



Will 2016 Record More Add-ons Than Last Year?
As a proportion of overall U.S. buyout activity, add-ons have gone from strength to strength. But the latest quarterly numbers have topped them all. In the first quarter of 2016, add-ons comprised 68% of all private equity buyout activity. While this percentage will likely decline as the year goes on, it’s still a testament to how PE investment strategies have shifted, particularly in the current environment. PE firms are engaging in buying and building of their portfolio holdings more than ever, doubtless in order to help position their holdings in the event of an economic slowdown. 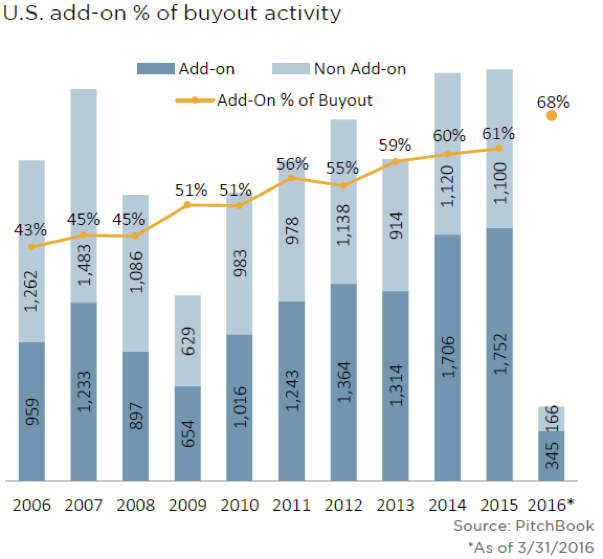 But there are additional motives, namely, the mitigation of initial purchase prices in an expensive climate by adding on. There are multiple anecdotes of investors lining up potential add-ons or identifying targets prior to the initial platform buyout, or even not considering deals without clearly defined add-on opportunities. Granted, adding on is largely a sector-determined trend. For example, one of the primary drivers in add-ons within the healthcare sector has been consolidation in fragmented markets, such as dermatology practices. Accordingly, for 2016 to break the decade high of 61% for add-ons’ proportion of buyouts, continued activity in such niches will have to continue at a healthy clip. More generally, as long as competition continues to be fierce and deal multiples relatively elevated, PE firms are likely to target add-on opportunities in the lower middle market, looking for some relief.




Latest news

LevFin Issuance Slows Across Products in August; DCM Remains a Bright Spot
The leveraged capital markets business continued to decelerate from just about every aspect, even for August standards. Overall issuance (including…


Fitch Ratings’ U.S. Private Credit Default Rate Rose to 6.3% in August 2026
Fitch Ratings recorded a U.S. Private Credit Default Rate (PCDR) of 6.3% for the trailing 12 months (TTM) ended August 2026, up from 6.1% in July 2026 and a record high.