


PE’s historical performance still allures in a market plagued by uncertainty

View PitchBook’s 2017 Global PE & VC Fund Benchmarking Report: Part II Here
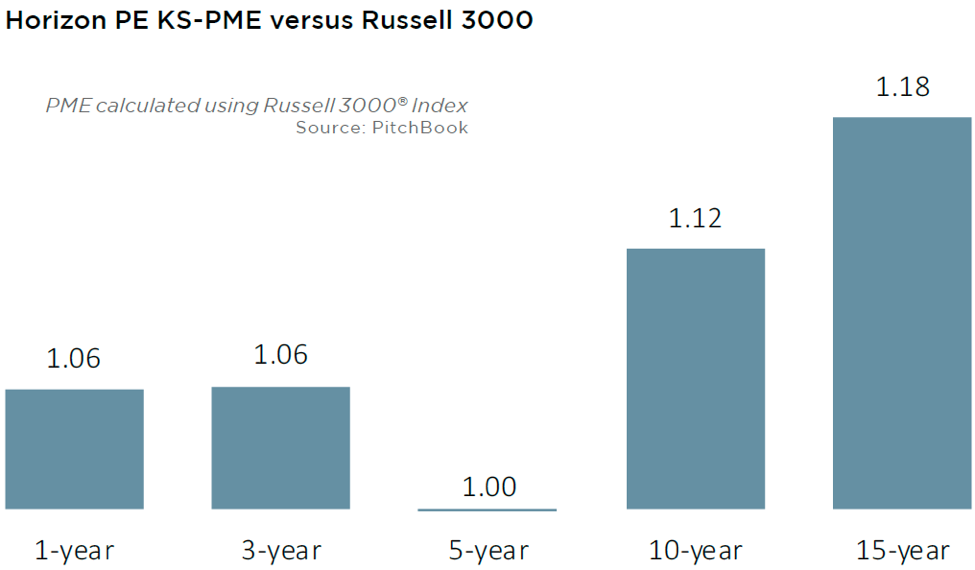
Comparing the returns of different strategies is difficult enough, given the typical disparities in approach. Assessing private equity’s performance relative to that of public markets is even more challenging, given illiquidity, timing, fees and more. At PitchBook, we have long used the Kaplan-Schoar public market equivalent (PME) method to analyze the PE asset class’s performance in context, as that approach is easier to interpret and potentially more resilient, given that it accounts for opportunity cost by discounting cash flows in cash multiple computation via returns to a public index since a fund’s inception. (The KS-PME method is agnostic to cash flow timing differences when comparing two different funds.) When applied across pooled horizons, things tend to get a bit abstract, but in brief the KS-PME method is used with pooled cash flows of all relevant PE funds across a given horizon. Thus, across a three-year horizon, using the Russell 3000 Index as the public index, PE fund cash flows in aggregate saw an implied outperformance of 6%. Despite a dip at the five-year horizon – perhaps attributable to negative net cash flows observed for several years because of the financial crisis among broader macro trends – the longer-term outperformance of PE is clear, although once again broader macro trends must be acknowledged. Within that 15-year horizon, not only did the financial crisis occur, but the tail and aftershocks of the dot-com crash affected the eldest vintages reporting cash flows. Moreover, recent increases in the effects of high-frequency trading and various spikes in volatility around political events further underscore the appeal of PE, an asset class that is subject to different flavors of risk that are potentially more palatable than those observed in public markets. Especially as the business cycle grows long in the tooth in the US and monetary policymakers’ arsenals remain sparse, continued strong fundraising by PE managers speaks to limited partners’ belief historical outperformance is likely to be repeated, if not to the same magnitude. Investors are by human nature averse to risk – but everyone prioritizes certain risks over others. Current concerns around heightened transaction multiples and hefty equity contributions are valid; many fund managers are likely to see their returns depressed somewhat should they have overpaid in the current market environment. That said, outperformance is outperformance: As long as PE fund performance net of fees still can be judged worthwhile in context of other asset exposures, LPs will pay up.



Latest news

Top 50 BDCs Accounted for 75% of Nonaccrual Loan Cost in Q2’26
The 50 largest BDCs, on the basis of total debt investments as of the second quarter of 2026, accounted for 75% of the total aggregate reported value of nonaccrual debt at cost and fair value.

US private debt AUM ($B) by channel
In 2025 and the early part of 2026, the retail channel added AUM to the asset class at a much faster rate than institutional investors in both regions, with growth rates of 43.7% globally, 41.4% in the US, and 73. 1% in Europe through the beginning of 2026 compared with year-end 2024 figures.
