



View PitchBook’s 2017 PE & VC Exits Here
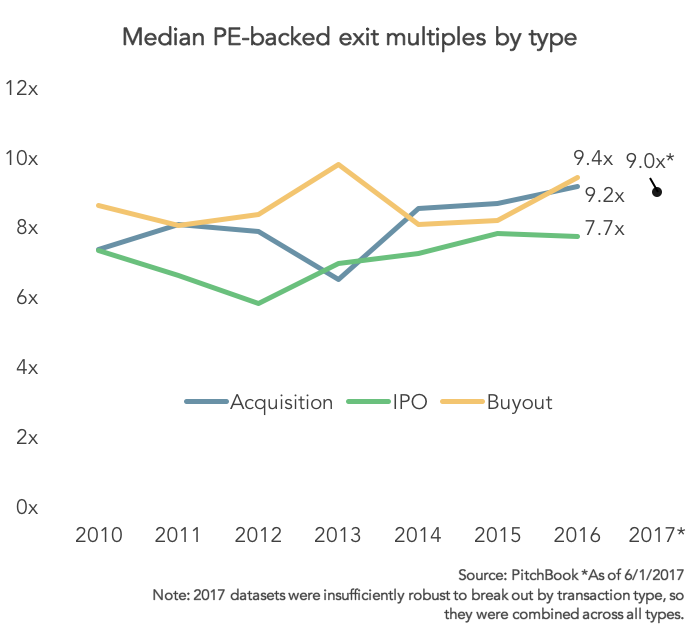
Slowly but surely, exit multiples for secondary buyouts and corporate acquisitions have risen over the past two years, with figures for the former topping off at 9.4x last year. Thus far in 2017, the aggregate figure for all transaction types stands at 9.0x. These sustained metrics suggest a confluence of factors: considerable sums of dry powder; opportunistic selling on the part of PE portfolio managers; and current difficulties in proprietary deal flow origination. Sourcing fresh investments is difficult at any time – the maturation of the buyout industry has only rendered it doubly so, leading to a significant increase in sponsor-to-sponsor transactions. As different firms embrace varying segments of the operational value-enhancing chain key to the buyout investment strategy, they can justify buying previously owned targets given their specialist focus or ampler resources. Hefty levels of dry powder to deploy in combination with still-amenable lending markets, enable more considerable equity contributions, should they be required, without overly levering underlying assets. Moreover, as PE firms still exit to strategic buyers at significant multiples despite overall slowing M&A activity, it’s clear they are still opportunistically selling off prime or best-placed assets. Testament to PE fund managers’ intense focus on portfolio optimization, this turnover speaks to the pressures PE investors have faced amid general perceptions of a slowing business cycle and artificially boosted asset valuations.



Latest news

US Leveraged Loans Return 3.36% to Investors YTD
The Bloomberg US Leveraged Loan Index (Ticker: LOAN) returned 0.96% in August and has gained an additional 0.28% through September…

PE dry powder
The capital that is being raised is flowing overwhelmingly to the largest, most established managers.

Middle market debt held by BDCs vs High yield vs Treasury yields
The blue line represents the current dividend yield of the VanEck BDC Income ETF (BIZD), which stood at 11.7% as…