



View PitchBook’s 2017 PE & VC Exits Here
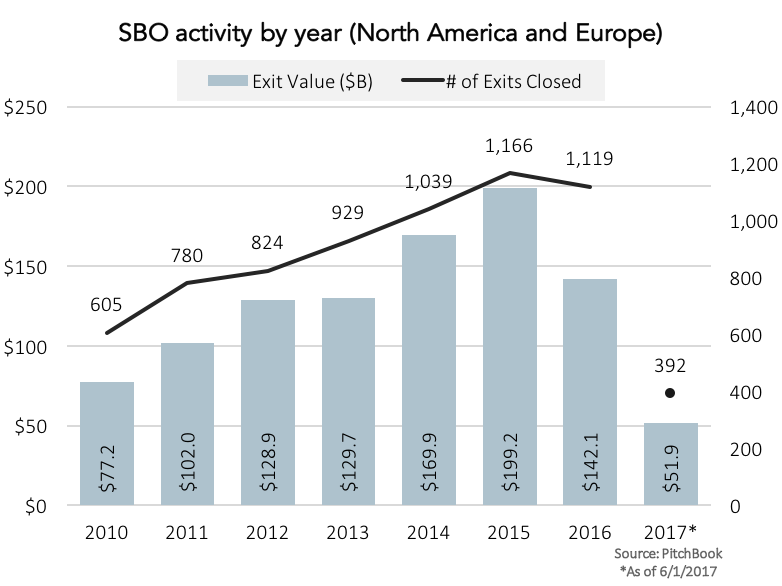
Secondary buyouts have been artificially propped up by the inflated volume of crisis-era investments for the past few years. “Like a snake digesting an elephant’s worth of assets,” as Bain & Co. phrased it, PE deals made from 2005 to 2008 slowly made their exits, topping out in 2015 in terms of secondary buyout activity. Decelerating slightly in 2016, pass-the-parcel deals have fallen off a cliff so far this year. As we outlined in our recent PE & VC Exits Report, SBOs would drop 30% in volume at their current pace and likely level out somewhat over the next few years.
So begins another cycle in the PE industry. Dry powder levels are well above even 2008 totals, and each PE-backed company that comes to market is said to spark a feeding frenzy among buy-side sponsors. As the last of the elephants pass through, we should get a clearer picture of the post-crisis SBO market and the changes PE firms are said to have made. SBOs are now justified via “complementary skillsets” between buyers and sellers—whether in terms of size, geography, strategy, or sector expertise, among others. It’s a perfectly valid trend, but it remains largely anecdotal. With so much money sloshing around chasing too few targets, buyers and sellers are focused on more than just each other’s skillsets, and likely will be for some time to come.



Latest news

Top 50 BDCs Accounted for 75% of Nonaccrual Loan Cost in Q2’26
The 50 largest BDCs, on the basis of total debt investments as of the second quarter of 2026, accounted for 75% of the total aggregate reported value of nonaccrual debt at cost and fair value.

US private debt AUM ($B) by channel
In 2025 and the early part of 2026, the retail channel added AUM to the asset class at a much faster rate than institutional investors in both regions, with growth rates of 43.7% globally, 41.4% in the US, and 73. 1% in Europe through the beginning of 2026 compared with year-end 2024 figures.
