



US MM Transaction Sizes Indicate Concentration in the Core
In the first half of 2016, the median size of buyouts in the US middle market declined slightly to $128.3 million, a slide of just over $11 million. Given PitchBook’s methodology of classifying the core middle market as transactions sized between $100 million and
$500 million, that figure indicates the continued concentration of dealmaking in the midrange of the US middle market, yet the slight slide is perhaps more interesting. As we have reiterated previously, the buyout cycle is slowing, for a variety of reasons.
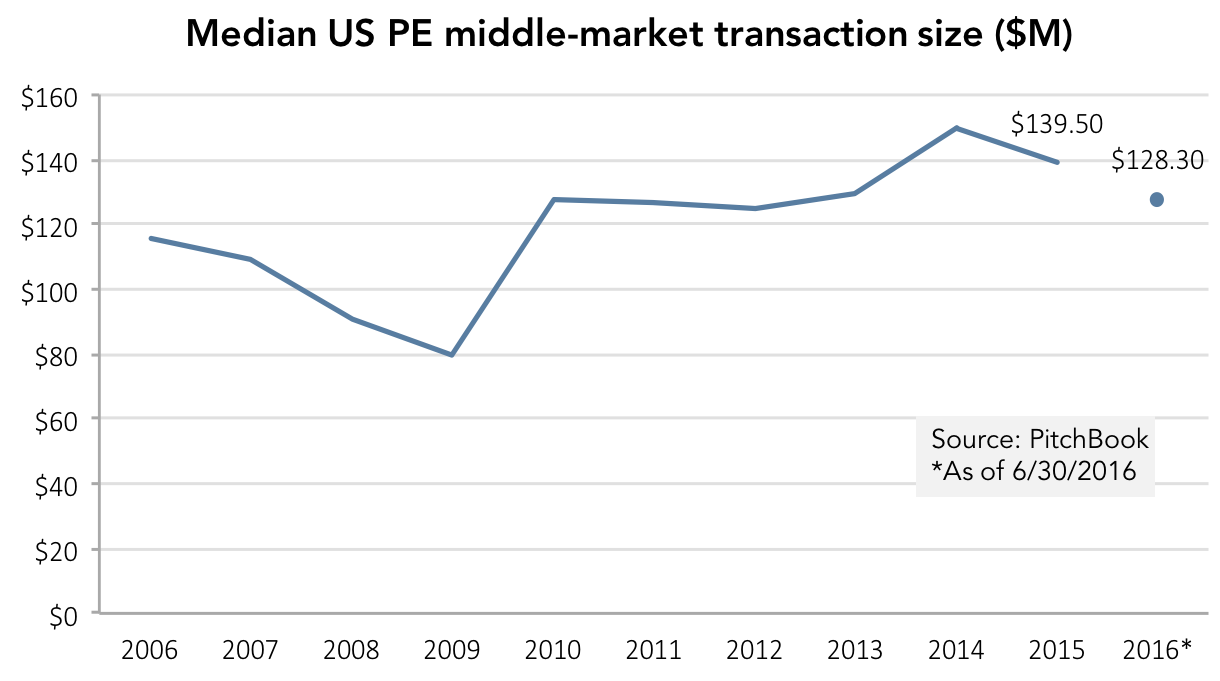 Regardless of whether the pipeline of deals is refilling, there exists an uneasy equilibrium between the quality of the typical company in the market, the pressure of capital overhang, and perceived political and economic volatility. Hence the gradual decline in both overall activity and the median transaction size, even in the core middle market. Investors can still pay up, but they aren’t as frequently as they used to. Whether that’s purely a matter of timing or not remains unclear—a resumption of dealmaking would suggest that timing is the culprit, and investors’ fears can be assuaged, while a new normal of subdued activity would indicate the buyout cycle is still slowly diminishing and dealmakers have by and large accepted that for the time being.
Read PitchBook’s 2Q 2016 U.S. PE Middle-Market Report here.



Latest news

US Leveraged Loans Return 3.36% to Investors YTD
The Bloomberg US Leveraged Loan Index (Ticker: LOAN) returned 0.96% in August and has gained an additional 0.28% through September…

PE dry powder
The capital that is being raised is flowing overwhelmingly to the largest, most established managers.

Middle market debt held by BDCs vs High yield vs Treasury yields
The blue line represents the current dividend yield of the VanEck BDC Income ETF (BIZD), which stood at 11.7% as…