



Download PitchBook’s 2Q 2017 US PE Middle Market Report click here.
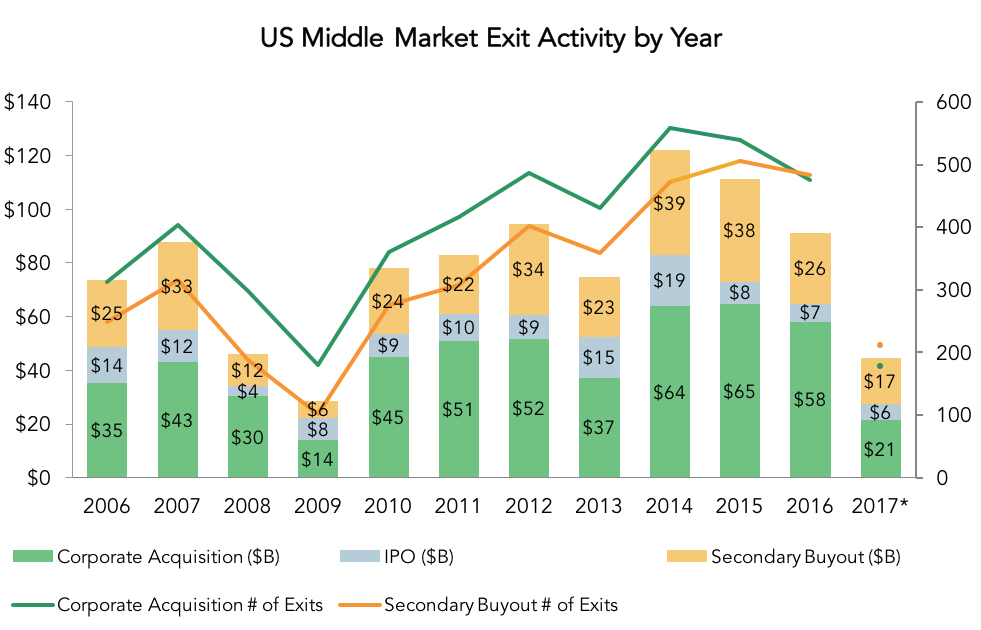
As we discussed last week, record-level fundraising is having an outsized effect on the PE middle market. So it comes as little surprise that secondary buyouts are taking a larger share of exit activity, with the data suggesting an upswing in so-called “upward sells” – smaller middle market funds selling to larger ones that can unlock more value as companies grow. It certainly isn’t a new trend, but it’s worth noting that secondary buyouts edged out strategic sales by count for the first time last year, and they’re outpacing strategic sales by a healthy margin so far in 2017. We think this might be the case going forward, given the number of large upper-middle-market funds raised in the last few years. That would be a positive for the lower middle market and the healthy growth of companies under PE ownership.
More broadly, slowing exit activity is having an impact on the middle-market company inventory. The percentage of PE-backed companies held for more than five years shot up to 40% in 1H 2017, a big jump from the 32% that were that old in the 2016 inventory. That’s also the largest percentage we’ve recorded in our dataset. Without another surge in exit activity like the one we saw in 2014-2016, that could pose a liquidity issue for middle-market investors. If the rising trend of “upward sells” holds, we expect to see that percentage creep down over time. With exits via M&A and IPO on a downward trend, however, we don’t expect strategic acquirers or the public markets to provide significant outlets for aging portfolios. A PE industry weighed down by dry powder is more likely to step up to the plate.
Contact: Alex Lykken
alex.lykken@pitchbook.com



Latest news


Number of smaller funds dwindles
Analysis of fund-close data found that vehicles valued at under $250m have seen a rapid decline since 2024.While PEI Private…

US Private Credit Transparency Highlights Uneven BDC Performance
Credit performance across business development company (BDC) portfolios remains uneven, although reported losses and non-accruals were broadly stable quarter over quarter, according to Fitch Ratings’ Private Credit Transparency Monitor for 2Q26.