



Download PitchBook’s Report here.
US PE fundraising trended down in 2018. No surprise there—more than $200 billion was cumulatively raised in both 2016 and 2017, totaling nearly $442 billion altogether in the span of two years. As we’ve noted in the past, the current fundraising market bears a hint of opportunism, and all windows close eventually. Last year’s fundraising haul was much more modest at $166.4 billion, which sits squarely with the totals we were used to seeing in 2013-2015. The difference between 2018 and 2017 largely comes down to fewer mega-funds raised: $107 billion worth of such funds closed in 2017 compared to about $53 billion last year. If mega-fund trends had continued apace, 2018 would have seen a third consecutive $200 billion year. Alas.
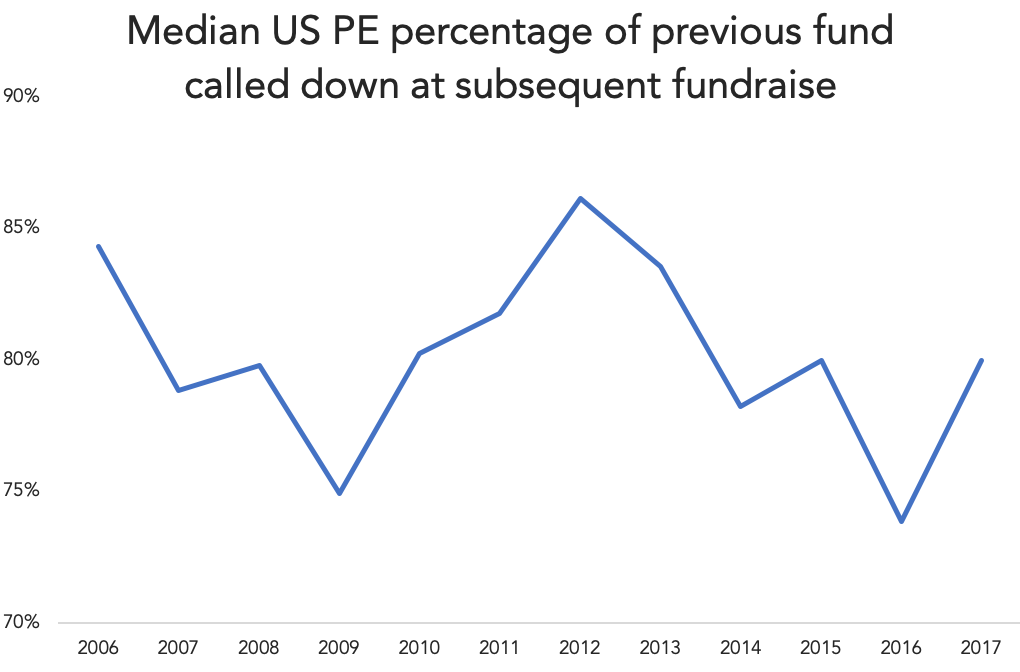
One discussion around current fundraising is how quickly new funds are going to market. GPs are waiting on average less than three years between vintages, versus more than four-year waits between 2010 and 2014. One concern that isn’t borne out in the data is a slowdown in capital calls. One may assume that raising funds at a faster clip will mean a significantly slower rate of investing for prior funds. And while there has been a visible shift, the pace of drawdowns has been consistent during the fundraising boom. The proportion of prior funds called down ahead of new fundraises has fluctuated between 74% and 86% since 2012. For example, GPs that raised 2017 vintages had called down almost 80% of their prior funds. That’s a high percentage, especially considering the popularity of subscription lines of credit. Concerns about dry powder becoming stale may be overstated, but one larger worry remains. eFront, an alternatives research and technology firm, noted an inverse trend between the speed of capital deployment and eventual returns. “Under pressure, fund managers might have less freedom to select the best opportunities over time.” The pressure is coming from LPs, of course, who have financed the boom but want to ensure that their money is being put to use regardless. “Putting pressure on fund managers to deploy capital could thus lead them to execute investments they would have normally decided to pass on.” But in a way, didn’t fund managers put themselves in this situation? Or is this an unavoidable consequence in a fundraising arms race?
Contact: Alex Lykken
alex.lykken@pitchbook.com



Latest news

European mid-market direct lending margins face steady compression since 2024
European mid-market direct lending margins have seen consistent compression over recent years but recorded a slight increase in the second quarter of 2026…

US leveraged loan issuance rebounds in September
Following three consecutive months of declining issuance, the US leveraged loan market has reversed course in September. Approximately $48.7b of…

Reversion to the Mean
Climbing toward the average is a very different story than surpassing it.