



Download PitchBook’s Report here.
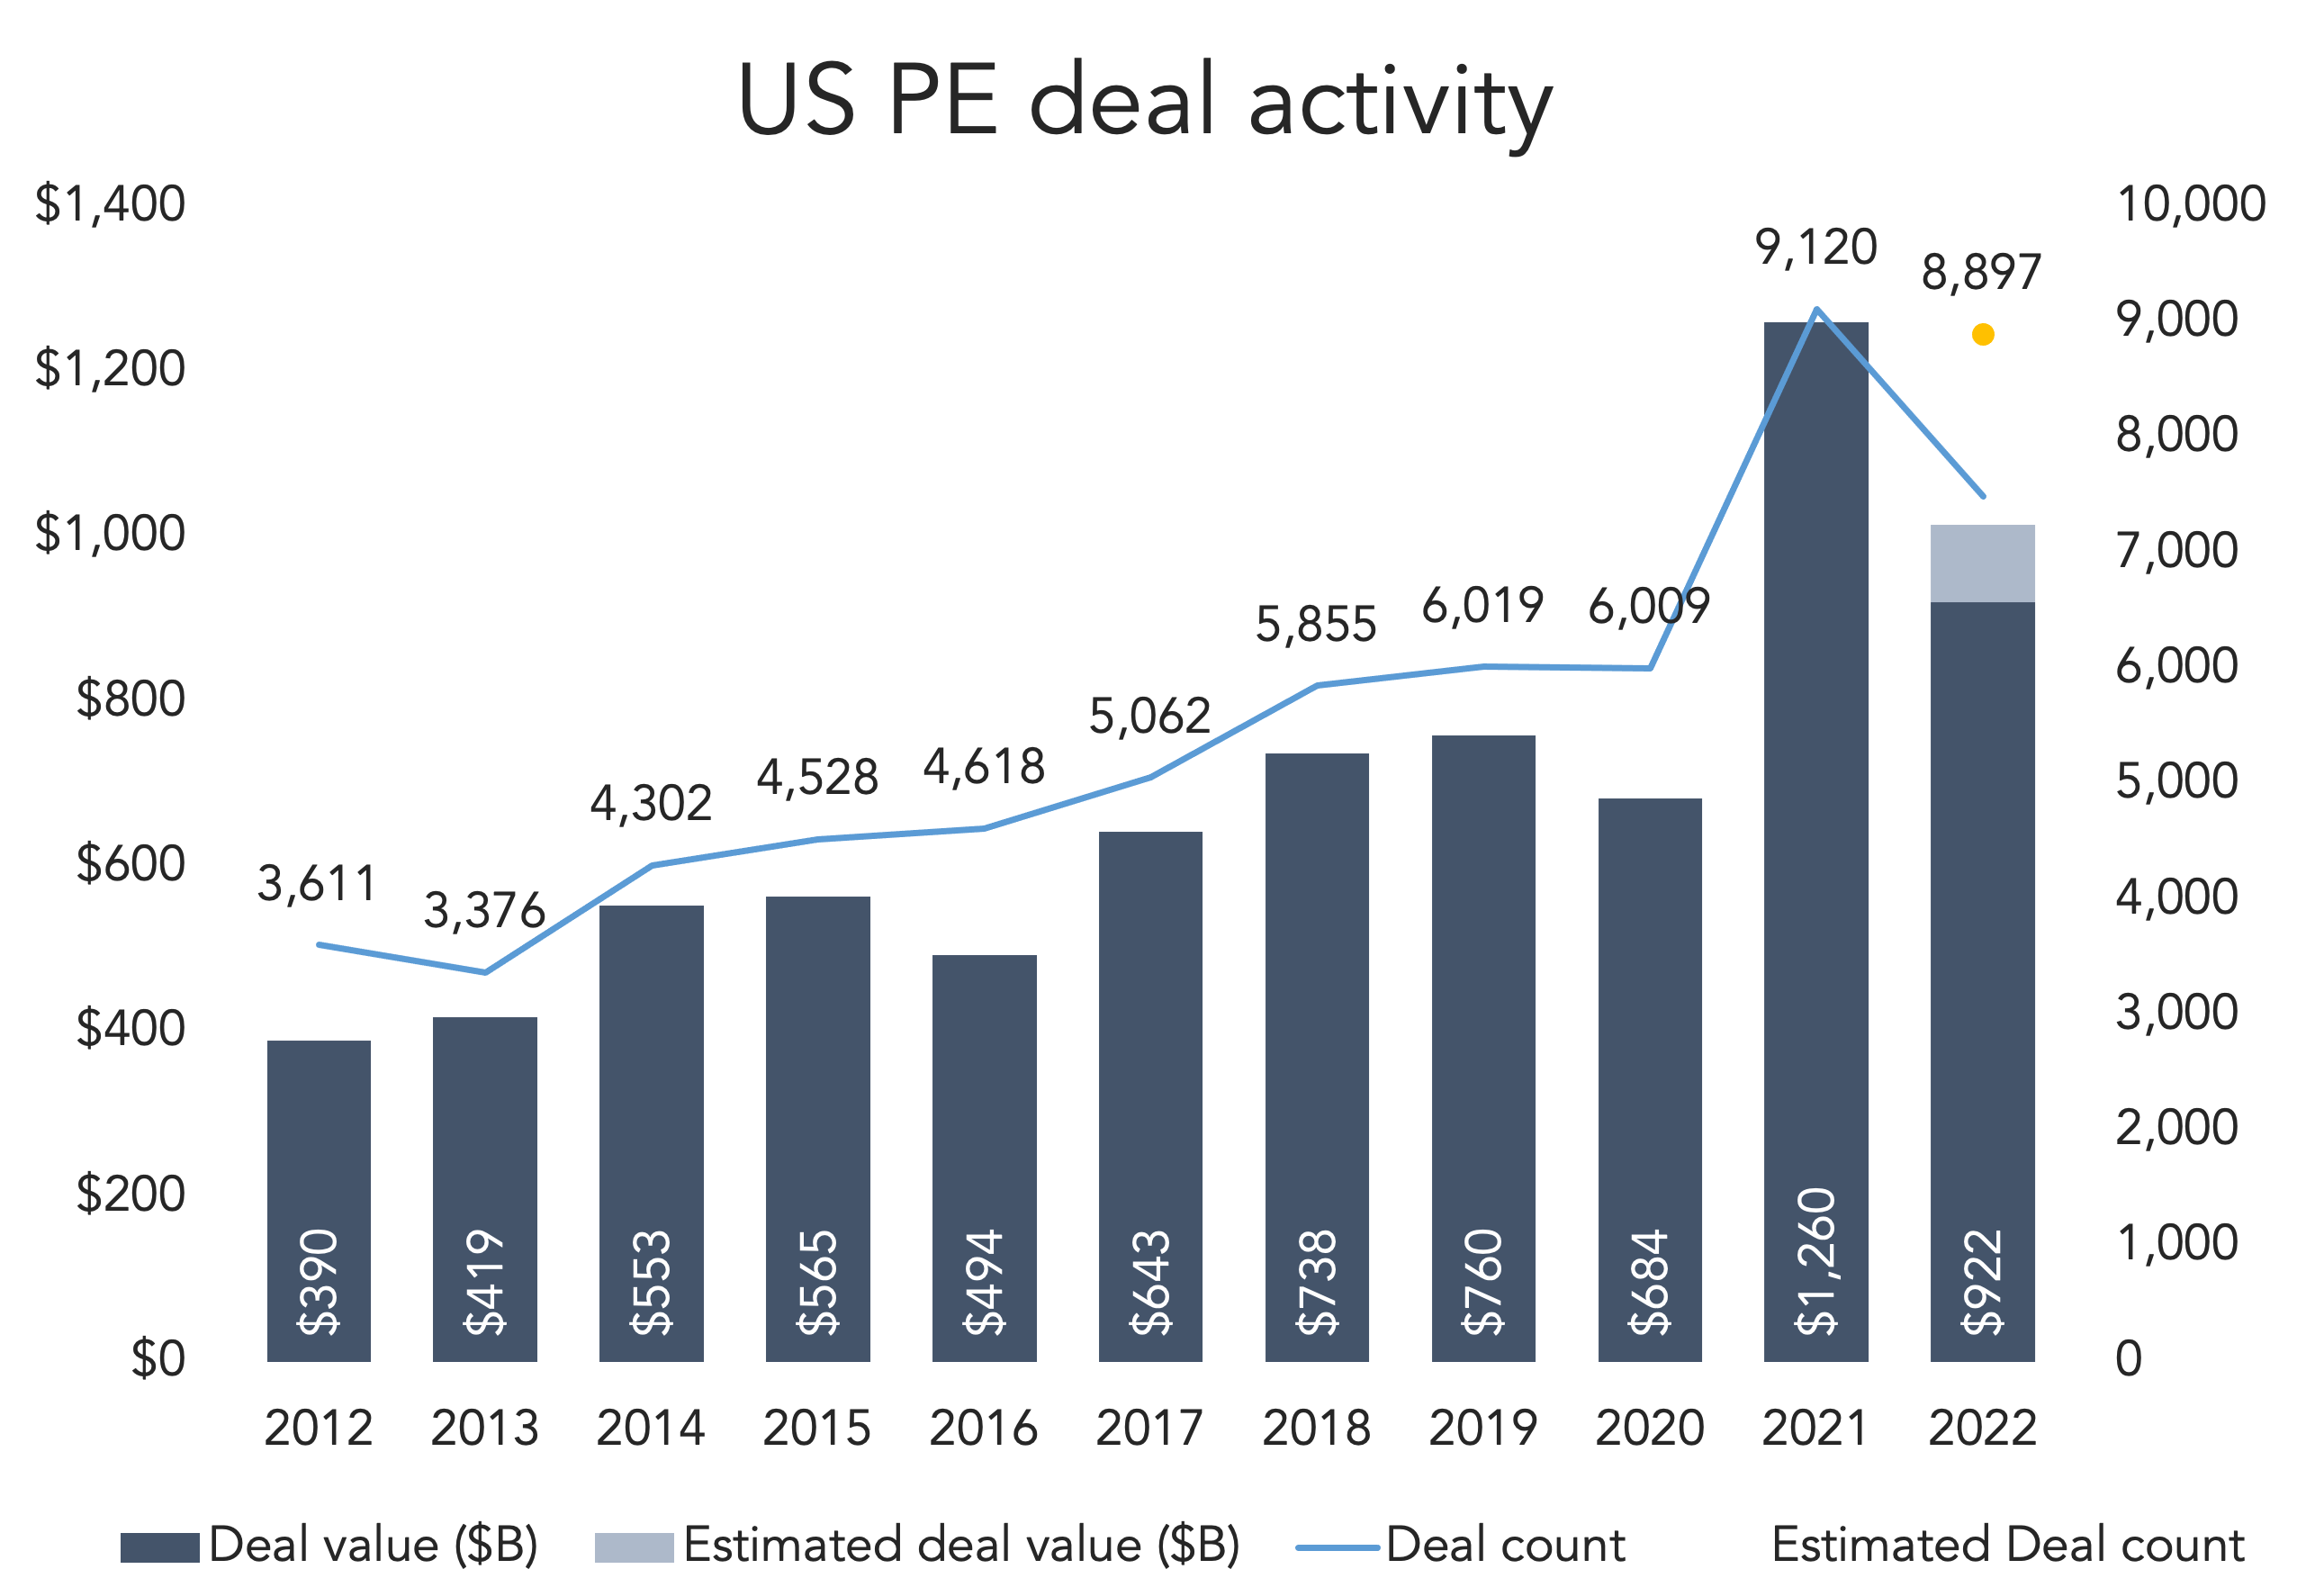
A down year, to be sure, but a healthy one by historical standards. PitchBook’s just-released US PE Breakdown, the annual version, estimates $1.01 trillion in capital invested in 2022. That’s down from 2021’s $1.26 trillion reading, but it’s another $1T showing nonetheless. More than half ($555 billion) of the total was front-weighted in the first two quarters, while quarters three and four were relatively soft. The market didn’t enter 2023 with the same oomph as it did last January.
Deal flow remained very steady, falling an estimated 2%, which means deals got considerably smaller. There was a pronounced shift toward buy-and-build last year: The add-on-to-LBO ratio went up about five percentage points YoY, from 73% to 78%. There was also an increase in growth deals, as well as PE firms buying smaller pieces of bigger companies. On the growth side, 2022 was a second consecutive year above the $100 billion mark. Typical growth deals involve little or no debt, and investors appear to be sticking with the strategy in an environment where financing has grown more difficult to nail down.
The report, which we’ll cover again next week, includes year-end exits totals, fundraising hauls, sector breakdowns, EBITDA and debt metrics, and updated performance figures. Download it for free here.
(Past performance is no guarantee of future results.)



Latest news

US Leveraged Loans Return 3.36% to Investors YTD
The Bloomberg US Leveraged Loan Index (Ticker: LOAN) returned 0.96% in August and has gained an additional 0.28% through September…

PE dry powder
The capital that is being raised is flowing overwhelmingly to the largest, most established managers.

Middle market debt held by BDCs vs High yield vs Treasury yields
The blue line represents the current dividend yield of the VanEck BDC Income ETF (BIZD), which stood at 11.7% as…