



Download PitchBook’s Report here.
Through Q3, PE exit activity is well into record territory, according to PitchBook’s latest US PE Breakdown. We’re estimating $638.3 billion in exited capital so far, including a blockbuster $283.7 billion exited in the third quarter alone. That’s a record by a wide margin, eclipsing the old record of three months ago (Q2) of $202.8 billion. The past two quarters have combined for over $486 billion of exits, which is more than any single year in our dataset.
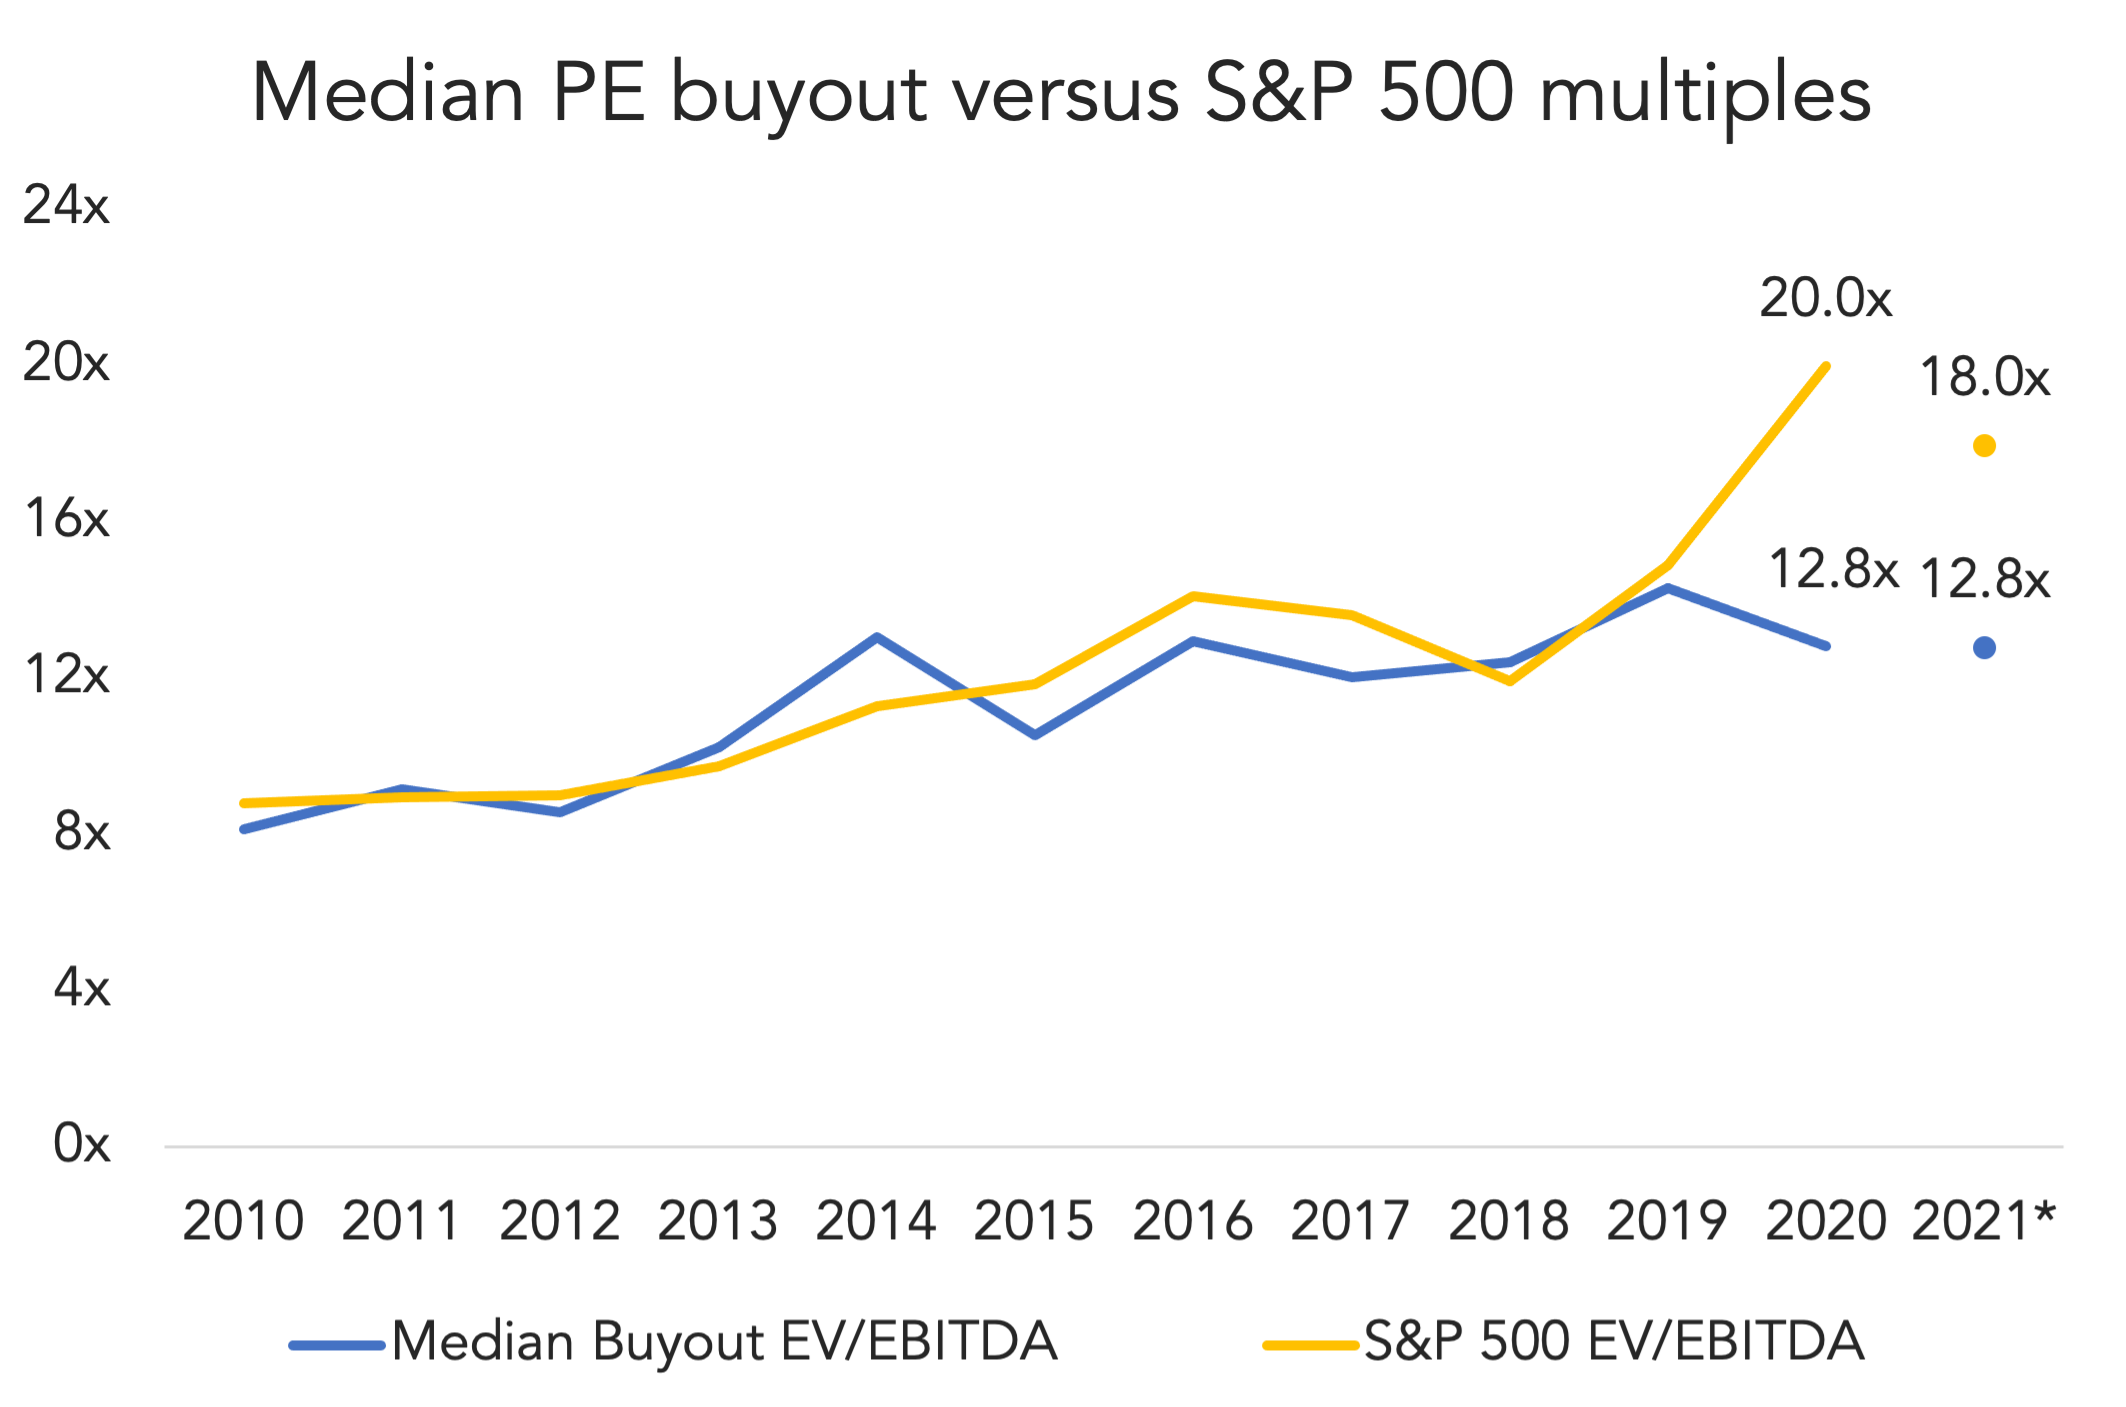
One reason for that is an explosion of public listings. We’ve counted more than 100 so far this year worth a combined $238.6 billion, both of which are records. The public markets are alluring right now, with the aggregate S&P 500 EV/EBITDA multiple trading at 18.0x. That’s more than five turns higher than the median buyout multiple, currently pegged at 12.8x. It’s not a perfect comparison, but the divergence is new and significant.
The M&A markets have also been healthy, though those exit figures aren’t as stratospheric. Strategic acquisitions have contributed over $165 billion to the total, a very healthy number historically. The M&A markets were nuanced during the pandemic, with many would-be buyers intentionally sidelining themselves while others took advantage. This year, corporates have regained their footing with stronger balance sheets, and took to the M&A market to position themselves for a post-COVID market. During the pandemic, being a PE-backed company meant having a financial safety net to ride through the turbulence. Sponsors can now match their portfolio companies with deep-pocketed strategics re-positioning themselves for the years ahead. Many of those portfolio companies have COVID-specific revenue streams, which strategics have been willing to pay up for.
(Past performance is no guarantee of future results.)



Latest news

US Leveraged Loans Return 3.36% to Investors YTD
The Bloomberg US Leveraged Loan Index (Ticker: LOAN) returned 0.96% in August and has gained an additional 0.28% through September…

PE dry powder
The capital that is being raised is flowing overwhelmingly to the largest, most established managers.

Middle market debt held by BDCs vs High yield vs Treasury yields
The blue line represents the current dividend yield of the VanEck BDC Income ETF (BIZD), which stood at 11.7% as…