



Download PitchBook’s Report here.
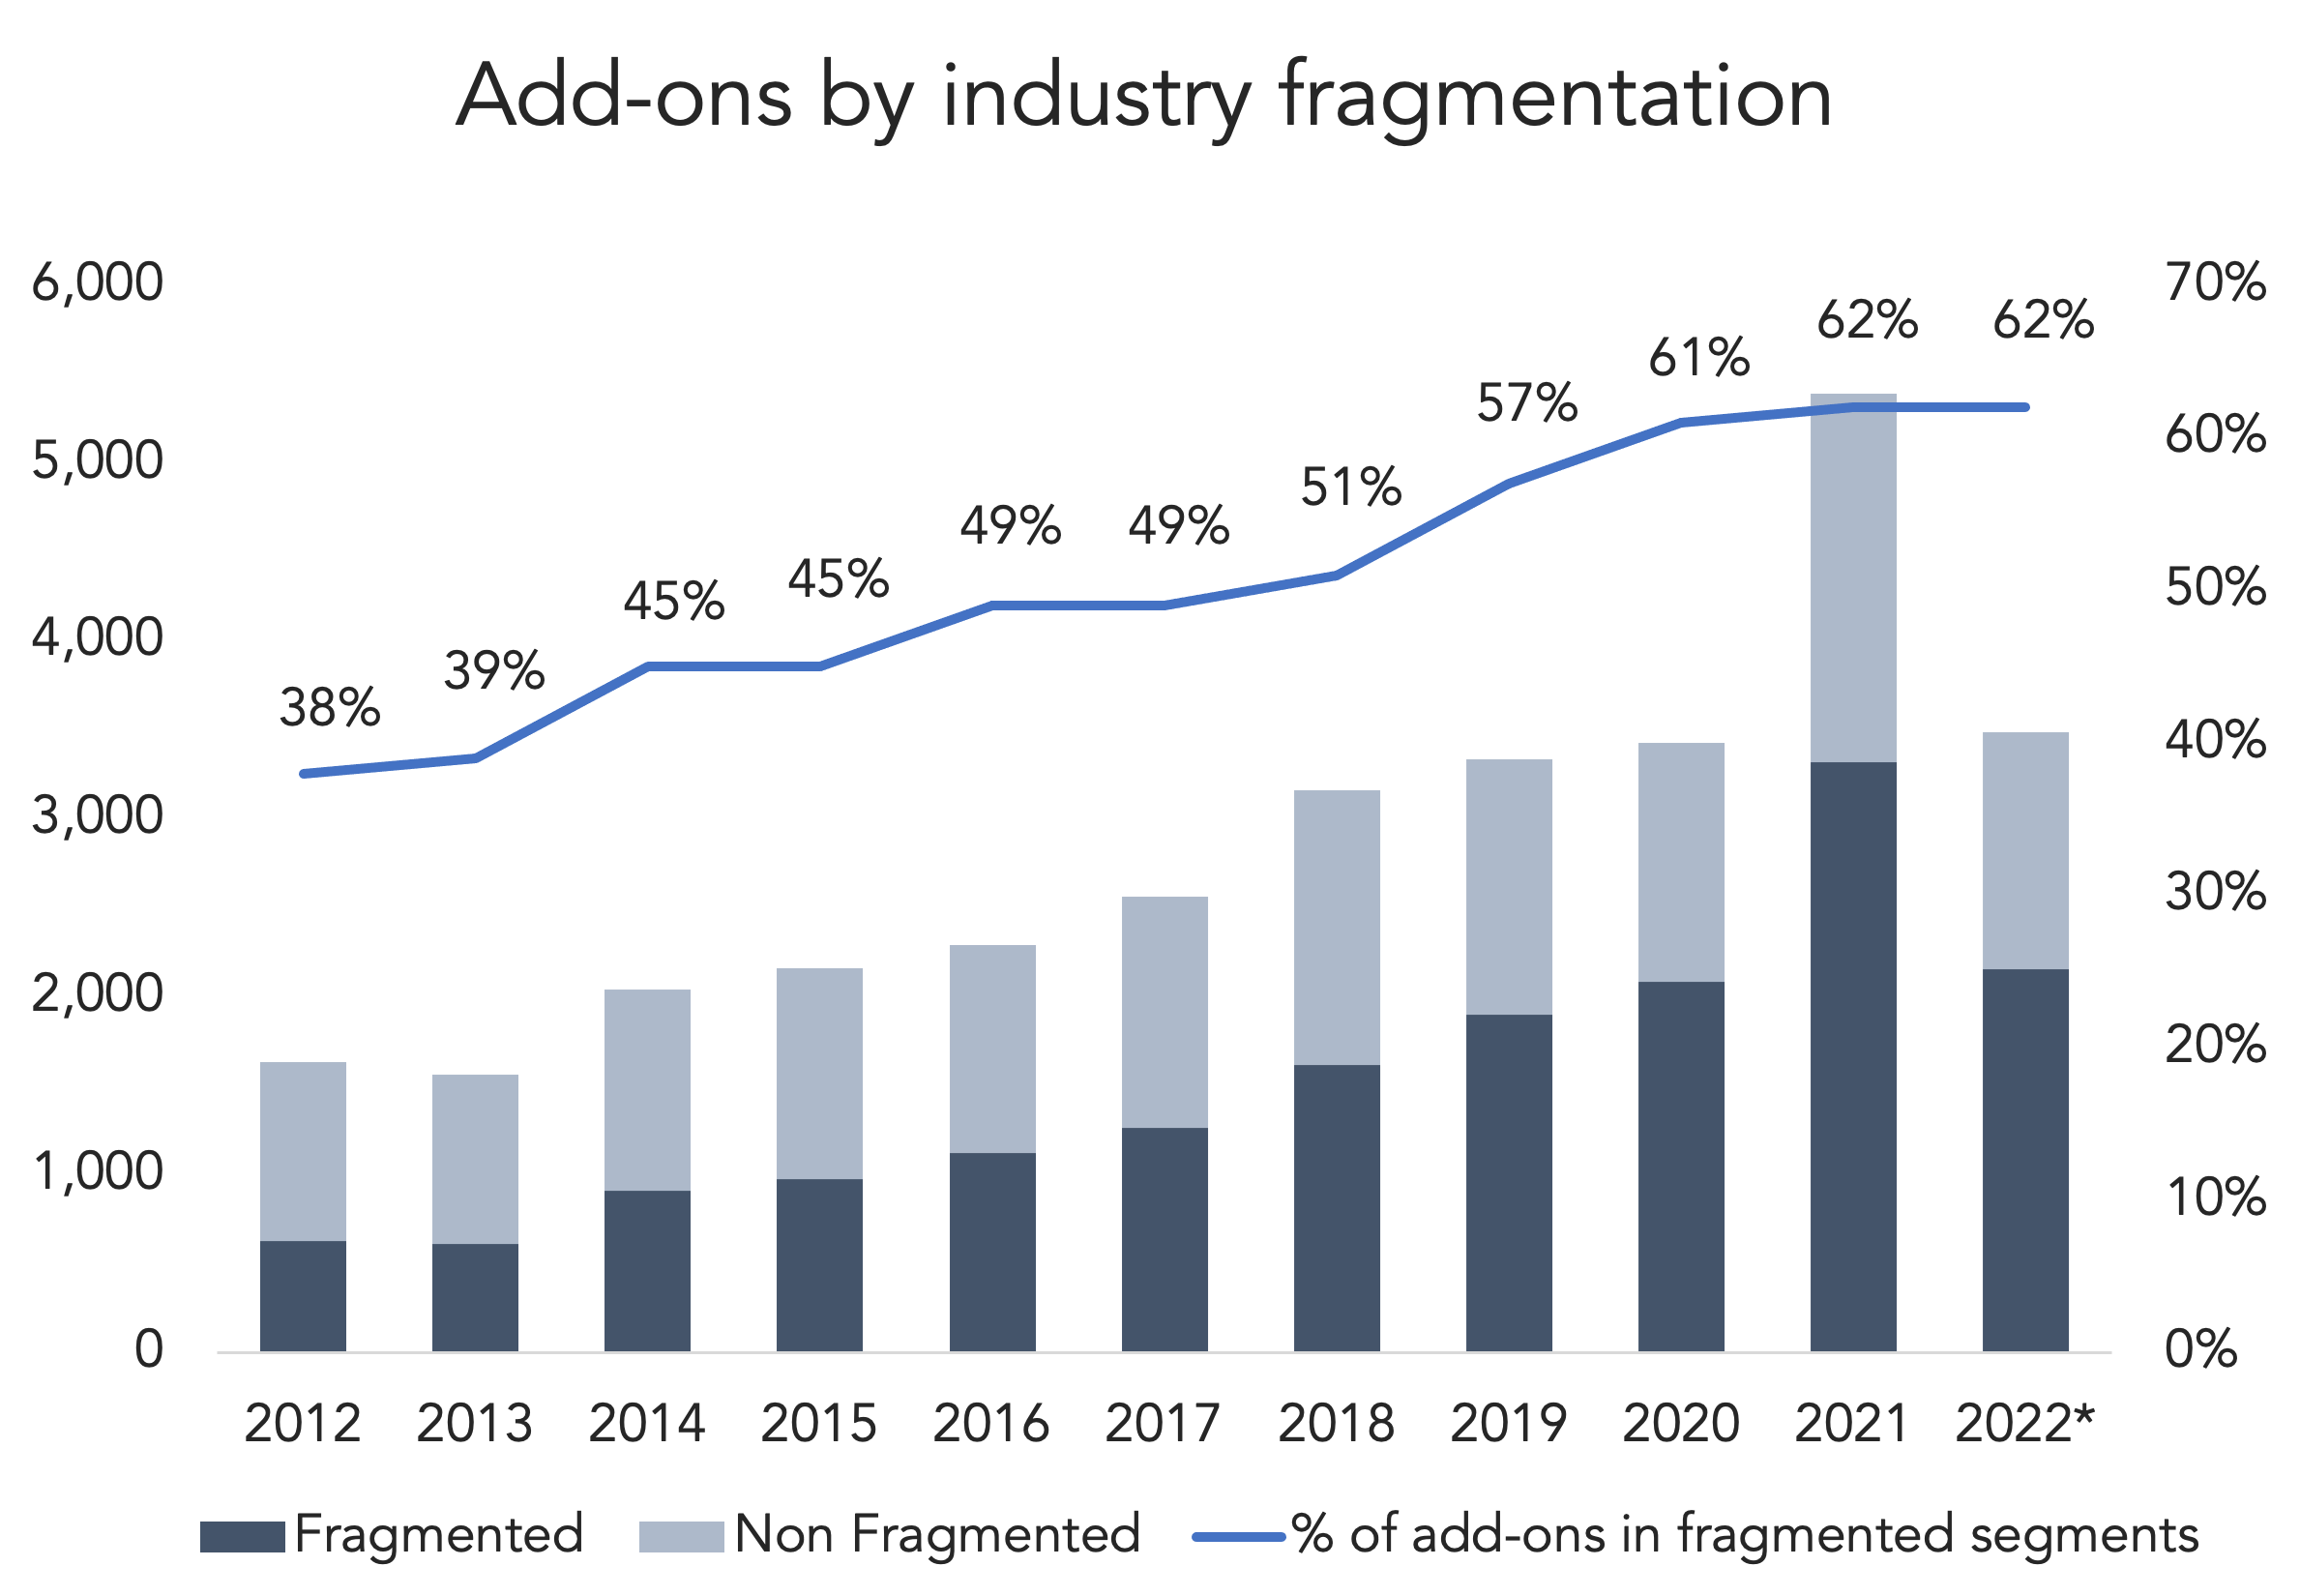
An upcoming project unearthed an interesting trend around add-ons: Over 60% of them are done by 10% of the industry codes tracked by PitchBook. Sectors like insurance and healthcare clinics are severely fragmented, which gives PE investors an opportunity to put the buy-and-build model into overdrive. When that playbook is used, it’s easy to pile up ten or more add-ons per platform, which boosts the overall add-on numbers. Aside from insurance brokerages and healthcare clinics, buy-and-build is prevalent in waste management, landscaping, consulting, advertising, marketing, pest control, fire protection and elevator services, among others. PitchBook’s add-on-to-LBO metric is now 77.9%, according to the Q3 US PE Breakdown, but that high percentage is fueled by about a dozen industries that, acquisition-wise, punch well above their weight.
(Past performance is no guarantee of future results.)



Latest news

Top 50 BDCs Accounted for 75% of Nonaccrual Loan Cost in Q2’26
The 50 largest BDCs, on the basis of total debt investments as of the second quarter of 2026, accounted for 75% of the total aggregate reported value of nonaccrual debt at cost and fair value.

US private debt AUM ($B) by channel
In 2025 and the early part of 2026, the retail channel added AUM to the asset class at a much faster rate than institutional investors in both regions, with growth rates of 43.7% globally, 41.4% in the US, and 73. 1% in Europe through the beginning of 2026 compared with year-end 2024 figures.
