



Download PitchBook’s Report here.
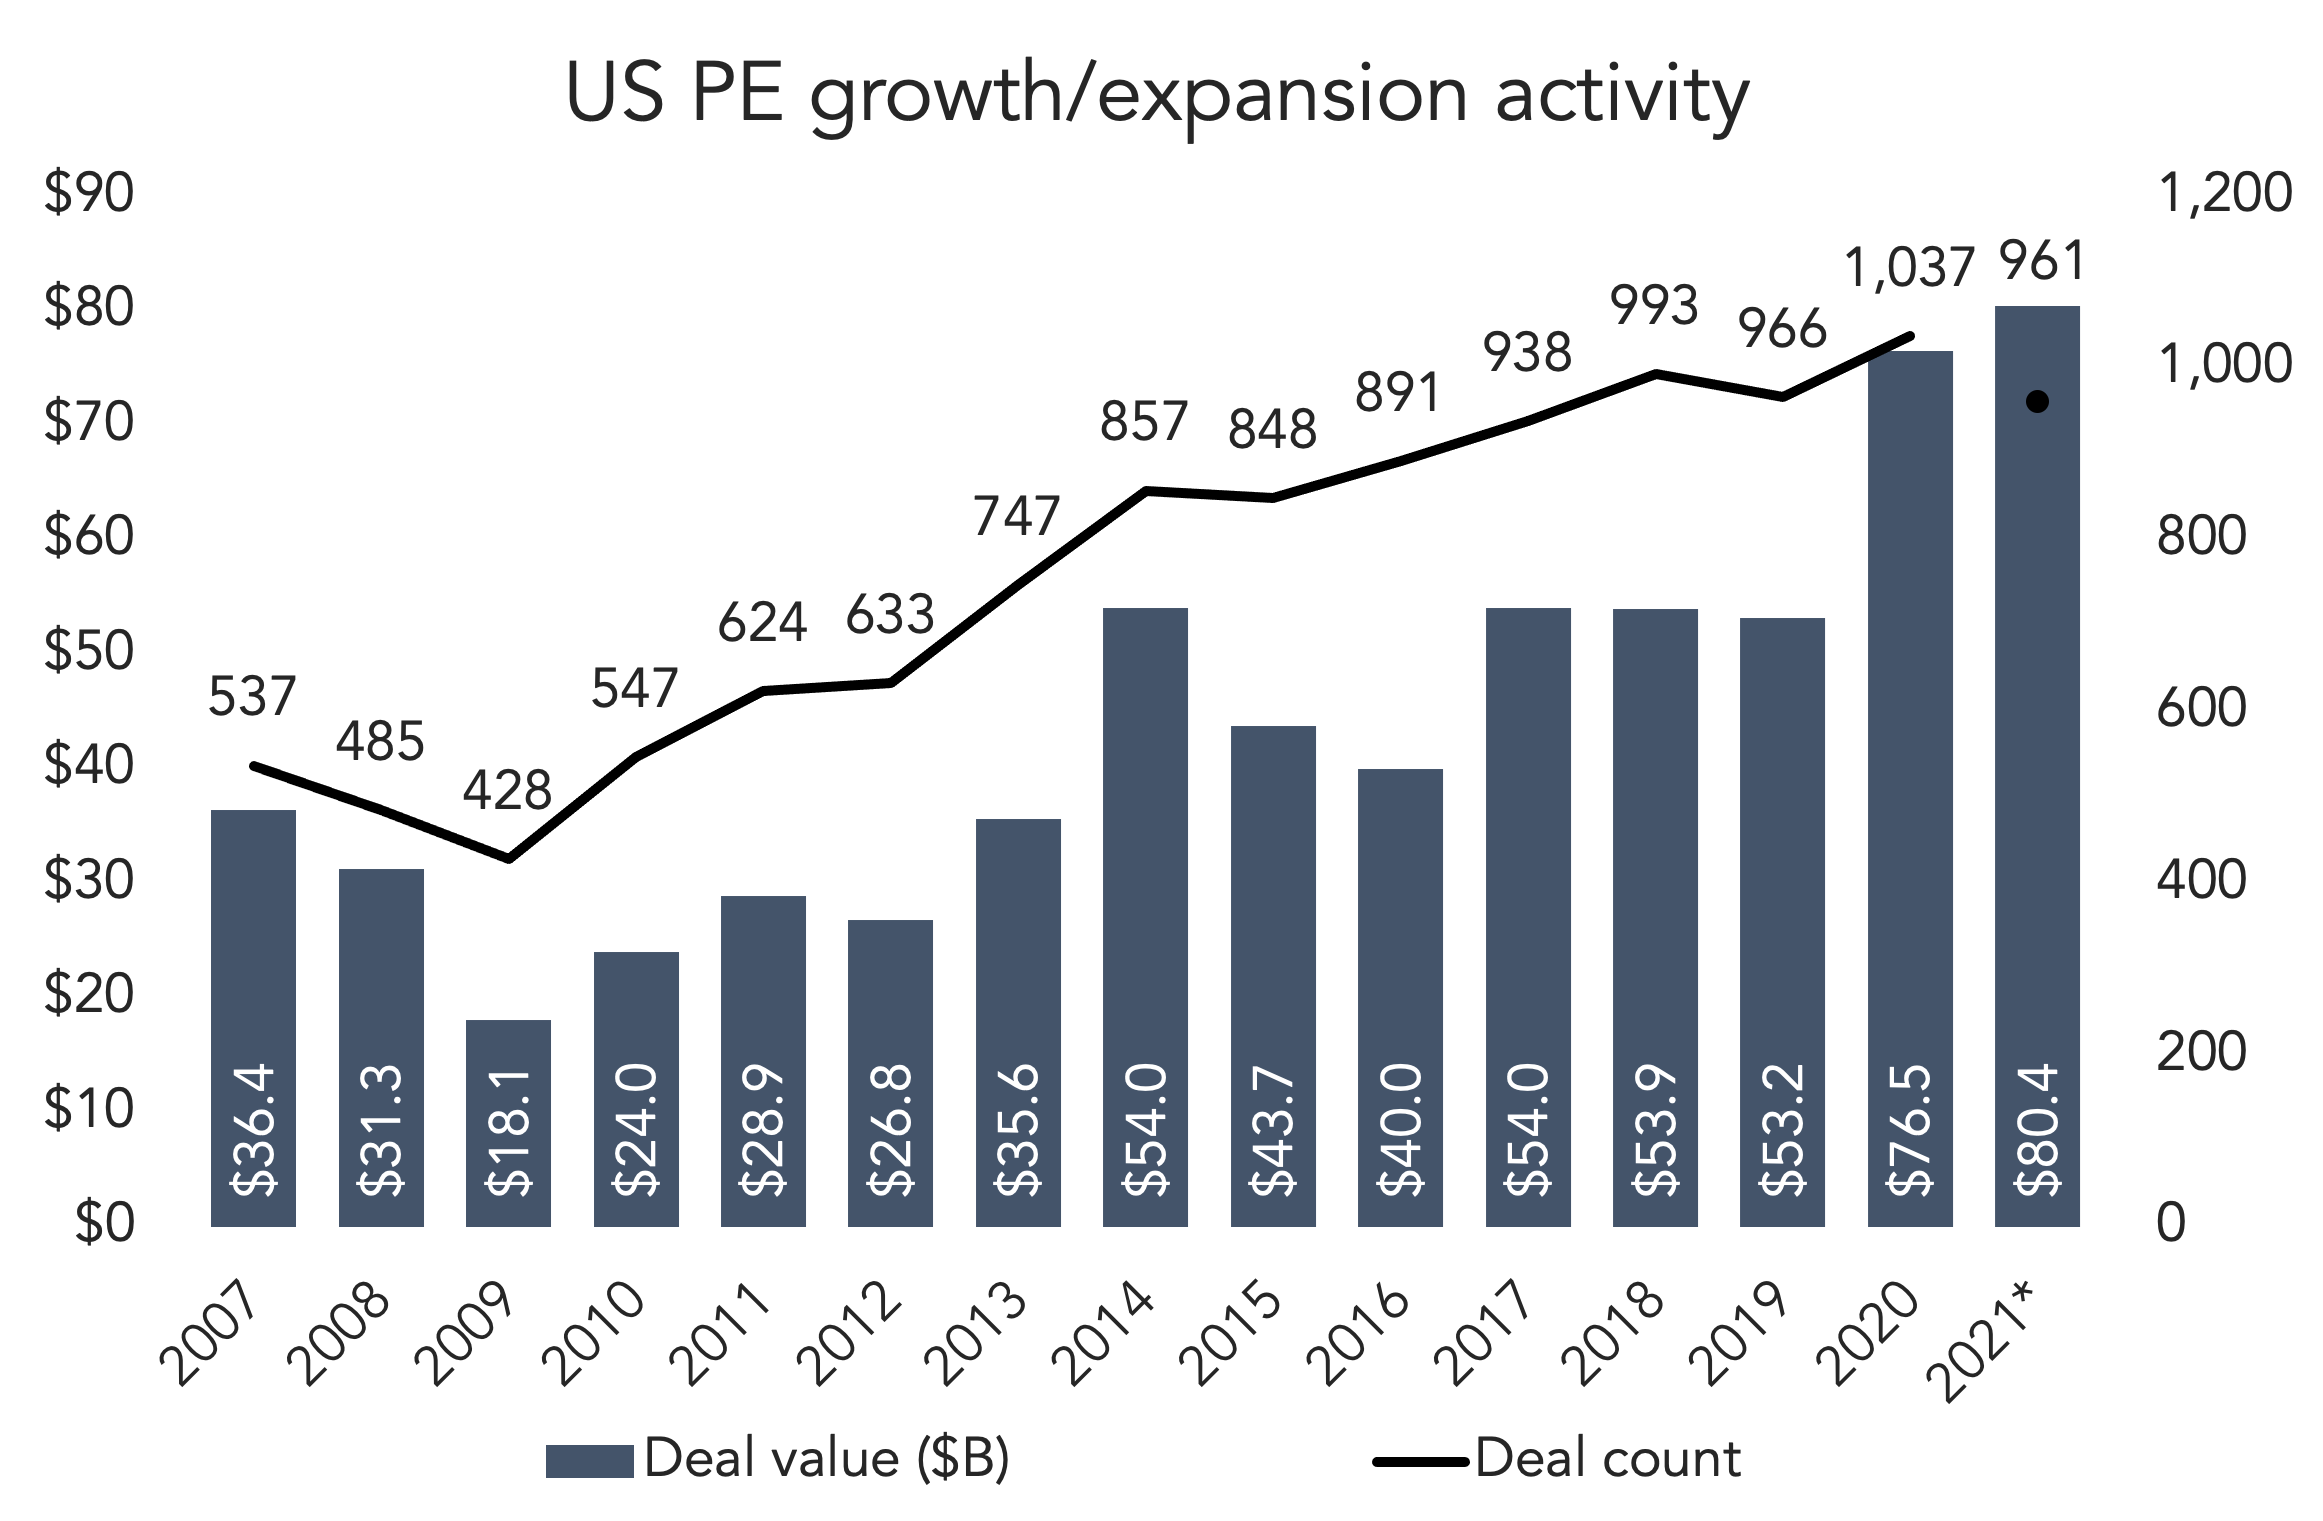
One sea change in the post-COVID PE market is the surge in growth deals. According to PitchBook’s latest US Breakdown Report, both 2020 and YTD 2021 have exceeded the $75 billion line, and 2021 is the first year we’ve gone past $80 billion. We’re on pace to see north of $100 billion in minority stake transactions this year, which would be much larger than anything we saw pre-COVID. Growth deals are also making strides compared to buyouts. When we filter out add-ons and directly compare minority/majority stake transactions, it’s almost 50/50. 1,031 LBOs have closed this year, not far ahead of the 961 growth deals recorded through Q3. That’s a breakdown of 52/48 between the two. In 2019, before the migration to growth deals began, the breakdown was 61/39. During the buyout boom in 2007, it was 73/27.
Market dynamics helped propel that trend last year. Not all business owners wanted to sell control of their companies because of a black swan event, especially if they had been performing well before 2020. Non-control stakes were a different story, and PE firms gave those businesses sturdy equity cushions to ride out the storm. At the same time, PE firms became bullish on tech-focused, late-stage venture rounds, blurring the lines between growth equity deals and venture financing. It’s a trend worth watching even as the pandemic passes—late-stage “growth” rounds can be a good fit for PE, aligning with their standardized holding periods, underwriting capabilities and risk/reward expectations.
(Past performance is no guarantee of future results.)



Latest news

Share of US private debt capital raised by strategy
At 43.6% of all capital raised in the US through the first half of 2026, direct lending remains the largest category of the asset class…

3Q26 M&A loan volume down quarter-over-quarter; 1-3Q26 totals up nearly 20%
3Q26 M&A loan volume totaled just under US$99bn (down over 25% year-over-year and 33% quarter-over-quarter), pushing issuance for the first…

Fundraising slows but record in sight
PEI Private Credit’s latest fundraising data shows a slowdown in Q3 in a year with huge momentum in the first…