


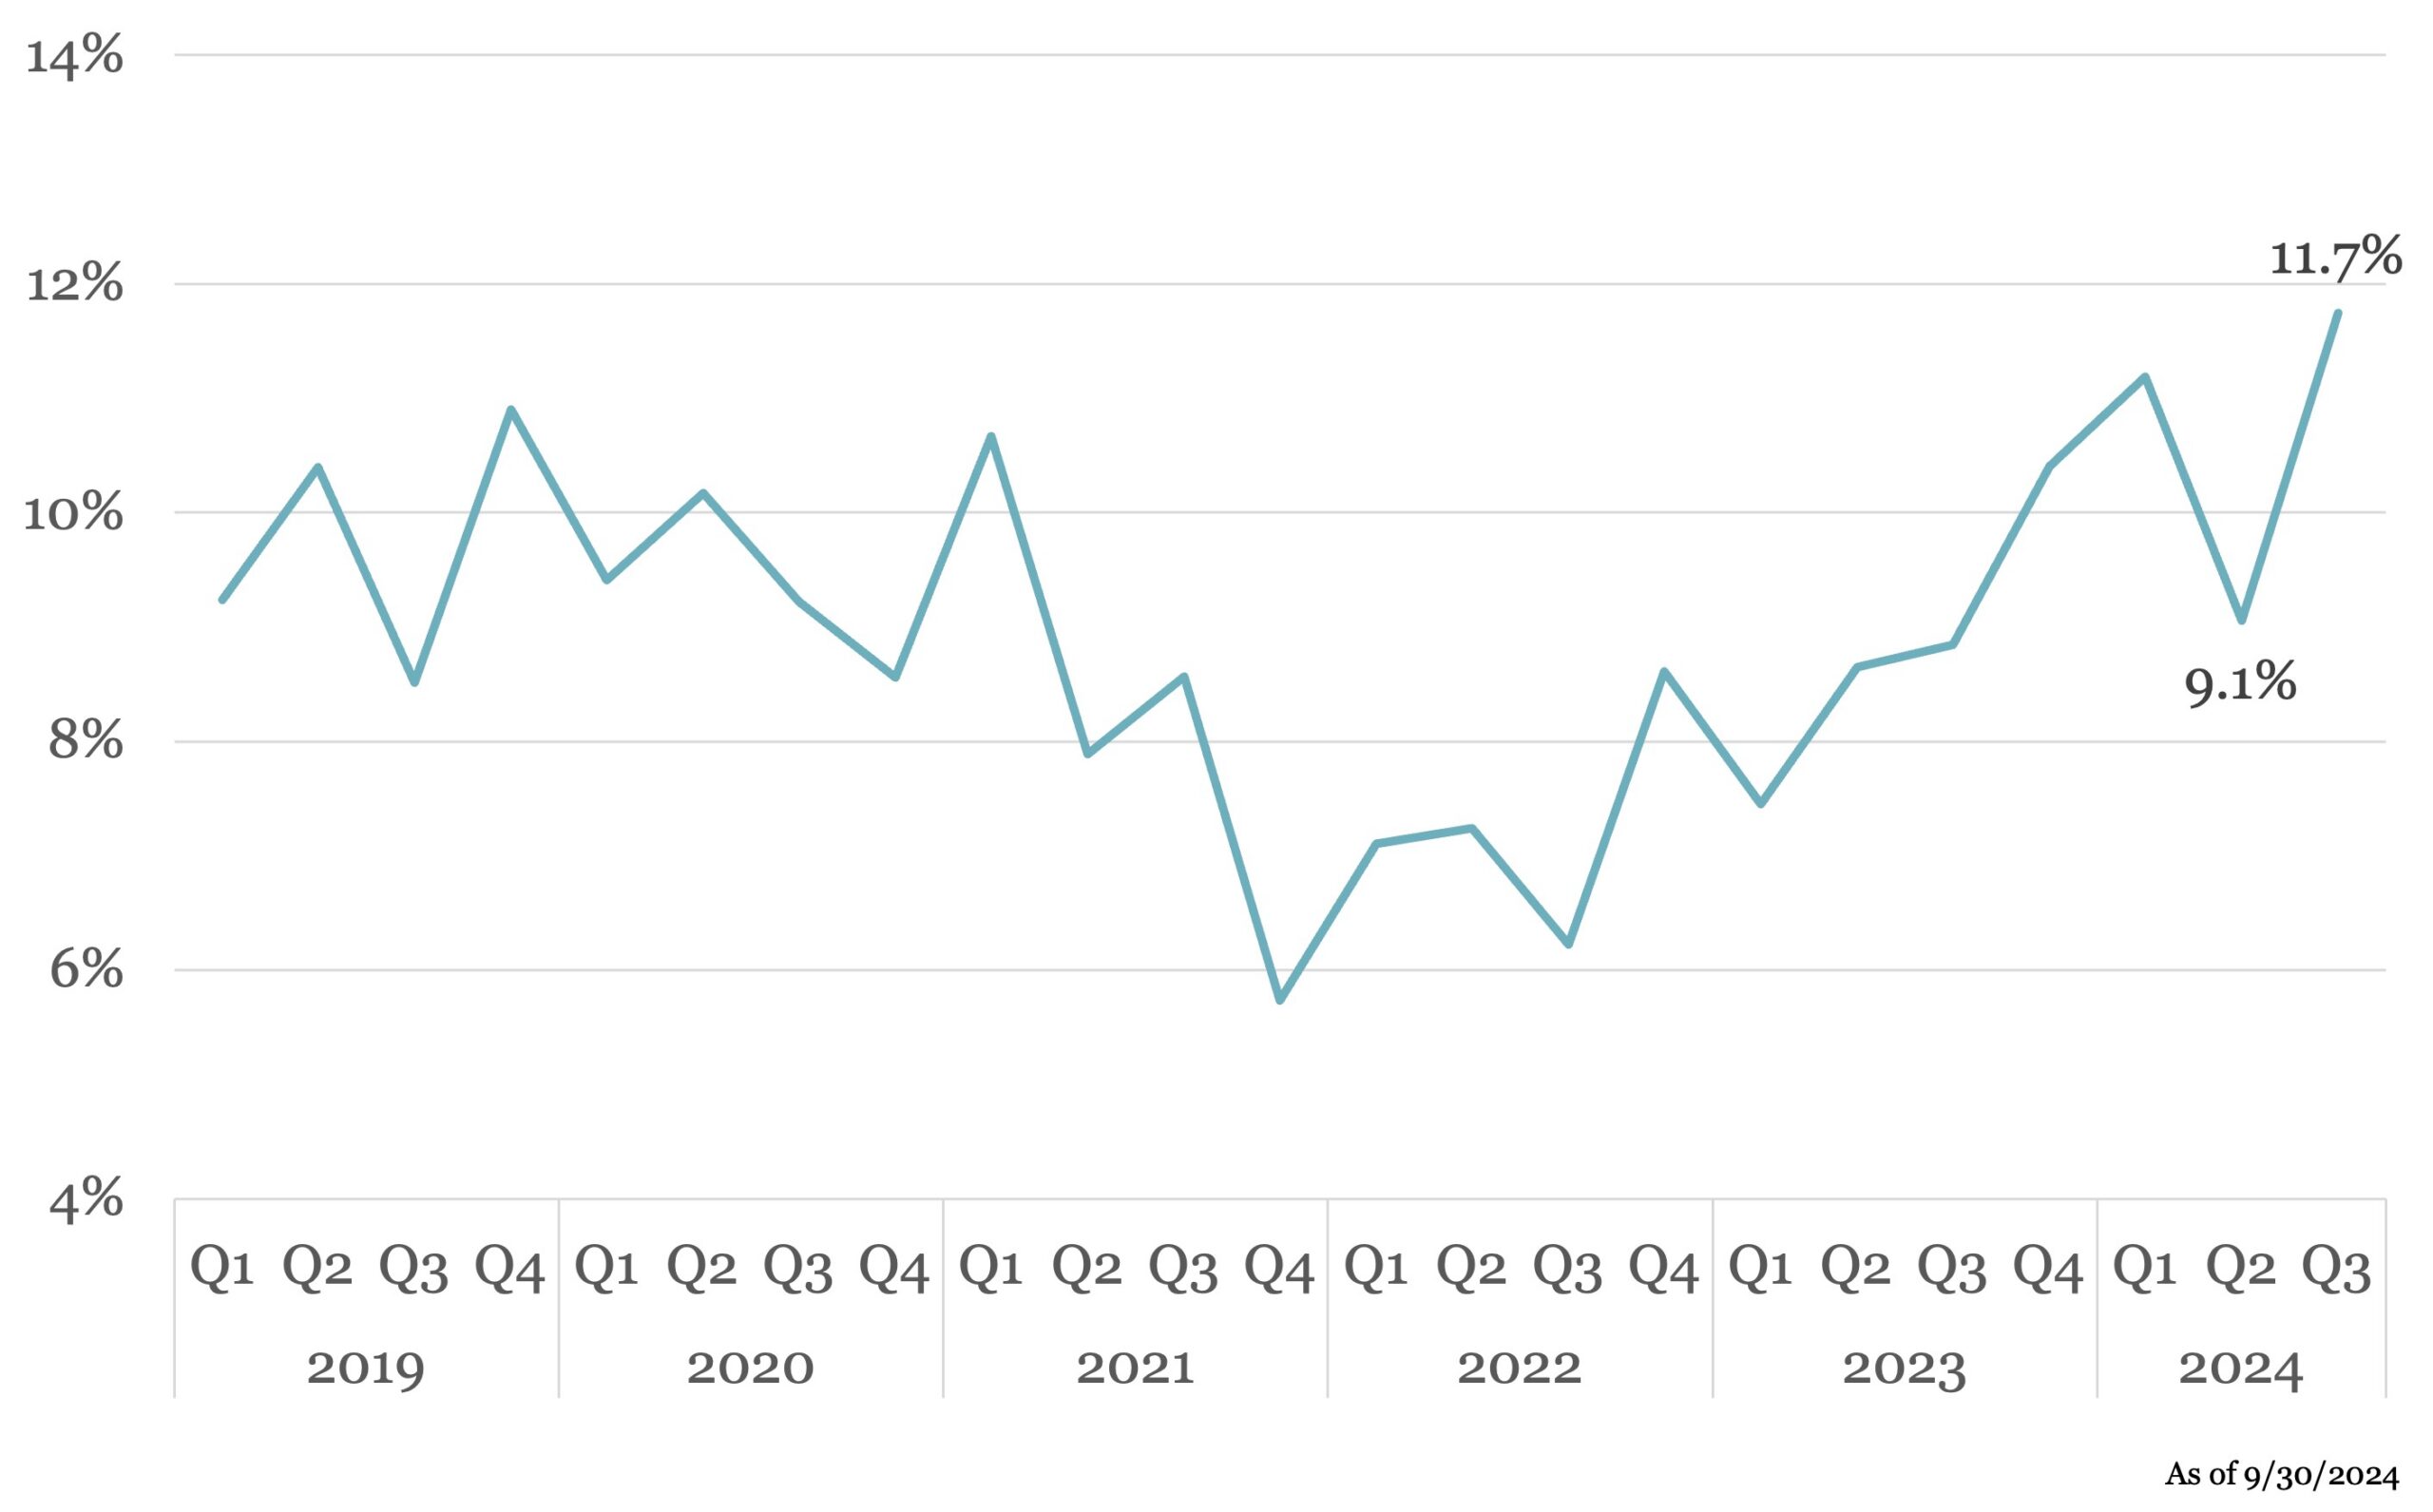
Carveouts/divestitures as a share of all US PE buyouts by quarter

PB icon
Content hub / Article / PitchBook / Carveouts/divestitures as a share of all US PE buyouts by quarter


Download PitchBook’s ReportĀ here.

Carveouts accounted for 11.7% of all US PE buyouts in Q3 2024, a rebound from the decline to 9.1% in Q2. Q1 and Q3 of this year have seen carveouts represent their largest share of buyouts in the US since the end of 2016 and surpass the 10-year quarterly average of 10.1%. As carveouts have become a more prominent source of buyout deal activity in recent quarters, it remains to be seen if a resurgence in traditional buyout activities led by a lowering cost of capital and an easing of other headwinds will result in carveouts seeing a diminished share of US buyout activity.

(Past performance is no guarantee of future results.)

2026 Private Credit Investor Survey

Share your perspective

2026 Private Credit Investor Survey

Institutional investors, RIAs and financial advisors - we want to hear from you. Take this two-minute anonymous survey and receive the results report.
Take the survey
US Private Credit League Tables 9M'26

Report

US Private Credit League Tables 9M'26

The definitive rankings covering private credit activity in 9M'26.
Download
LSEG LPC's Large Corporate Leveraged & Middle Market Loans Conference

NYC | October 29, 2026

LSEG LPC's Large Corporate Leveraged & Middle Market Loans Conference

Join 250 delegates for a full day of insightful discussions on the most pressing issues facing the loan market.
Learn more
PitchBook's H1 2026 Global Private Debt Report

Report

PitchBook's H1 2026 Global Private Debt Report

Strong fundamentals, but uncertainty remains.
Download

Latest news

    US leveraged loans returns turn negative in October

    The Bloomberg US Leveraged Loan Index (Ticker: LOAN) has returned -0.26% this month through October 21, reducing its year-to-date return…

    Read More

    M&A activity begins to tick upward

    In the third quarter of 2026, acquisition-linked loan volume across North America and Europe reached about $47 billion, up from $30.6 billion in Q2 and $29.5 billion a year ago.

    Read More

    High-Yield Bond Statistics

    Read More



