



Download PitchBook’s Report here.
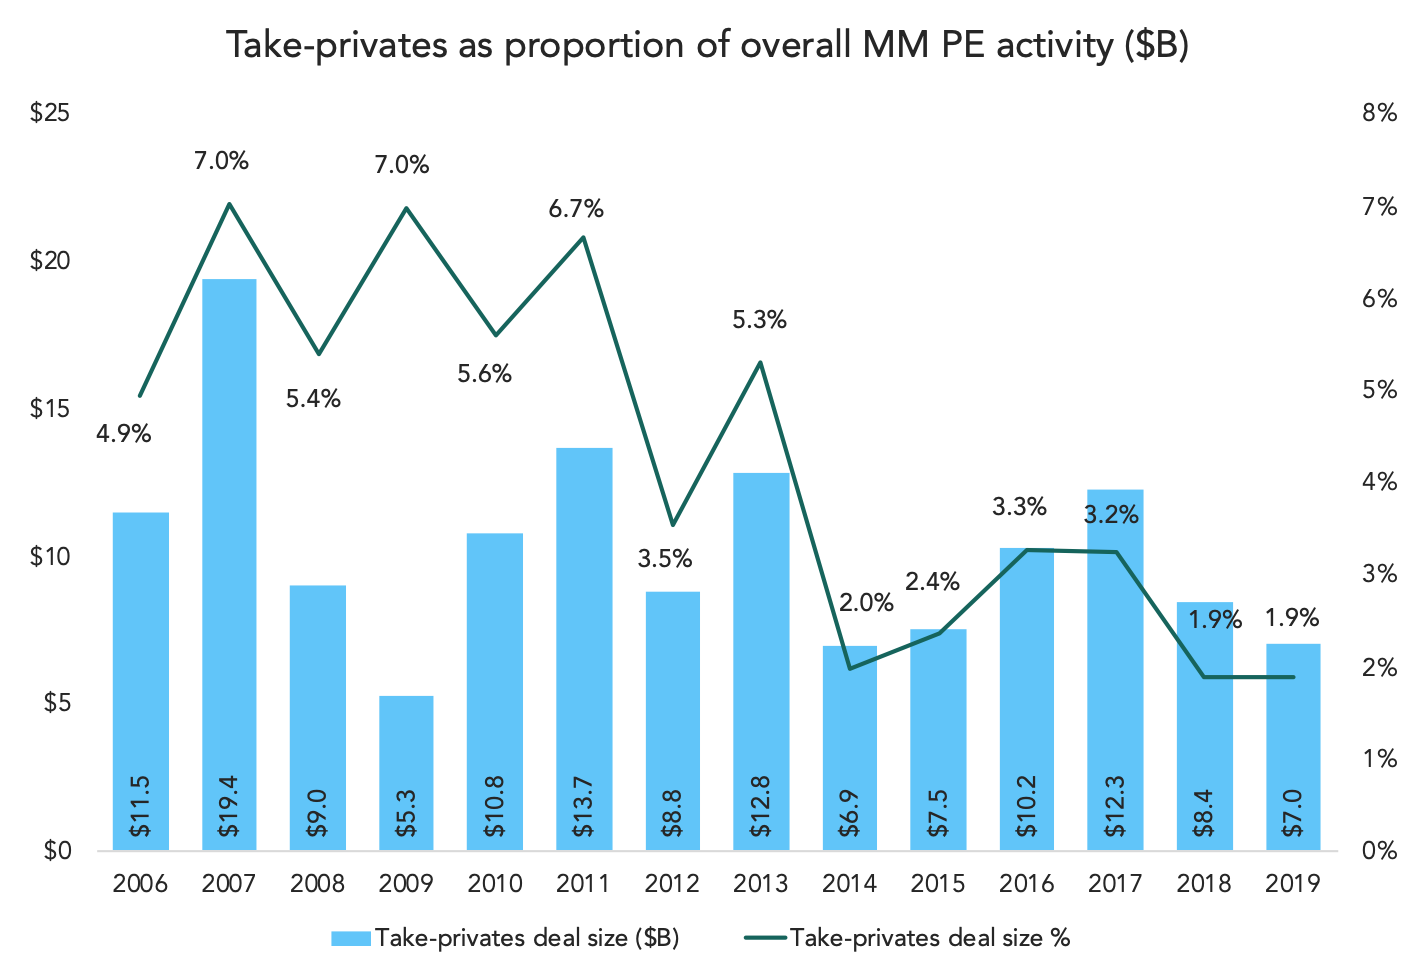
Middle market investors aren’t known for prolific take-private activity, but the percentages are surprisingly low. For the past two years, middle-market take-privates have accounted for less than 2% of all middle market activity. 2% is pretty skimpy. Dating back to 2014, MM buyouts have been responsible for about 2-3% of all MM activity. Further back, though, take-privates used to be more prominent in terms of deal sourcing. In 2007, for example, at the height of the buyout boom, they accounted for 7% of all MM deals. The 2006-2011 timeframe was consistently in the 5-7% window.
These aren’t huge percentages, but the sudden change in prominence, and the consistency of the smaller percentages going back to 2014, suggest that middle-market investors aren’t looking at public companies as much as they used to. The middle market as a whole saw almost $450 billion worth of activity last year. In 2011, when take-privates accounted for almost 7% of all MM buyouts, combined deal value across the entire middle market had eclipsed $200 billion for the first time. One possible explanation for today’s lower ratio: the middle market is that much bigger, with that many more new investors targeting more and more niches, that the public markets have become a relative afterthought to today’s investors, especially the newcomers.





Latest news

Rate hike expectations ease as term SOFR curve flattens
The CME six-month Term SOFR rate reached a recent high of 3.979% on July 28 before retreating to 3.837% as…

3Q26: New loan assets rise to 44% of total lending, a 3-year high
New loan assets as a proportion of total US loan volume make up 44% of the 3Q26 pipeline to date,…

North American GPs dominant as fundraising accelerates
Our PEI Private Credit 200 ranking also shows capital raising increasing overall – and accelerating especially fast for the largest…