



Download PitchBook’s Report here.
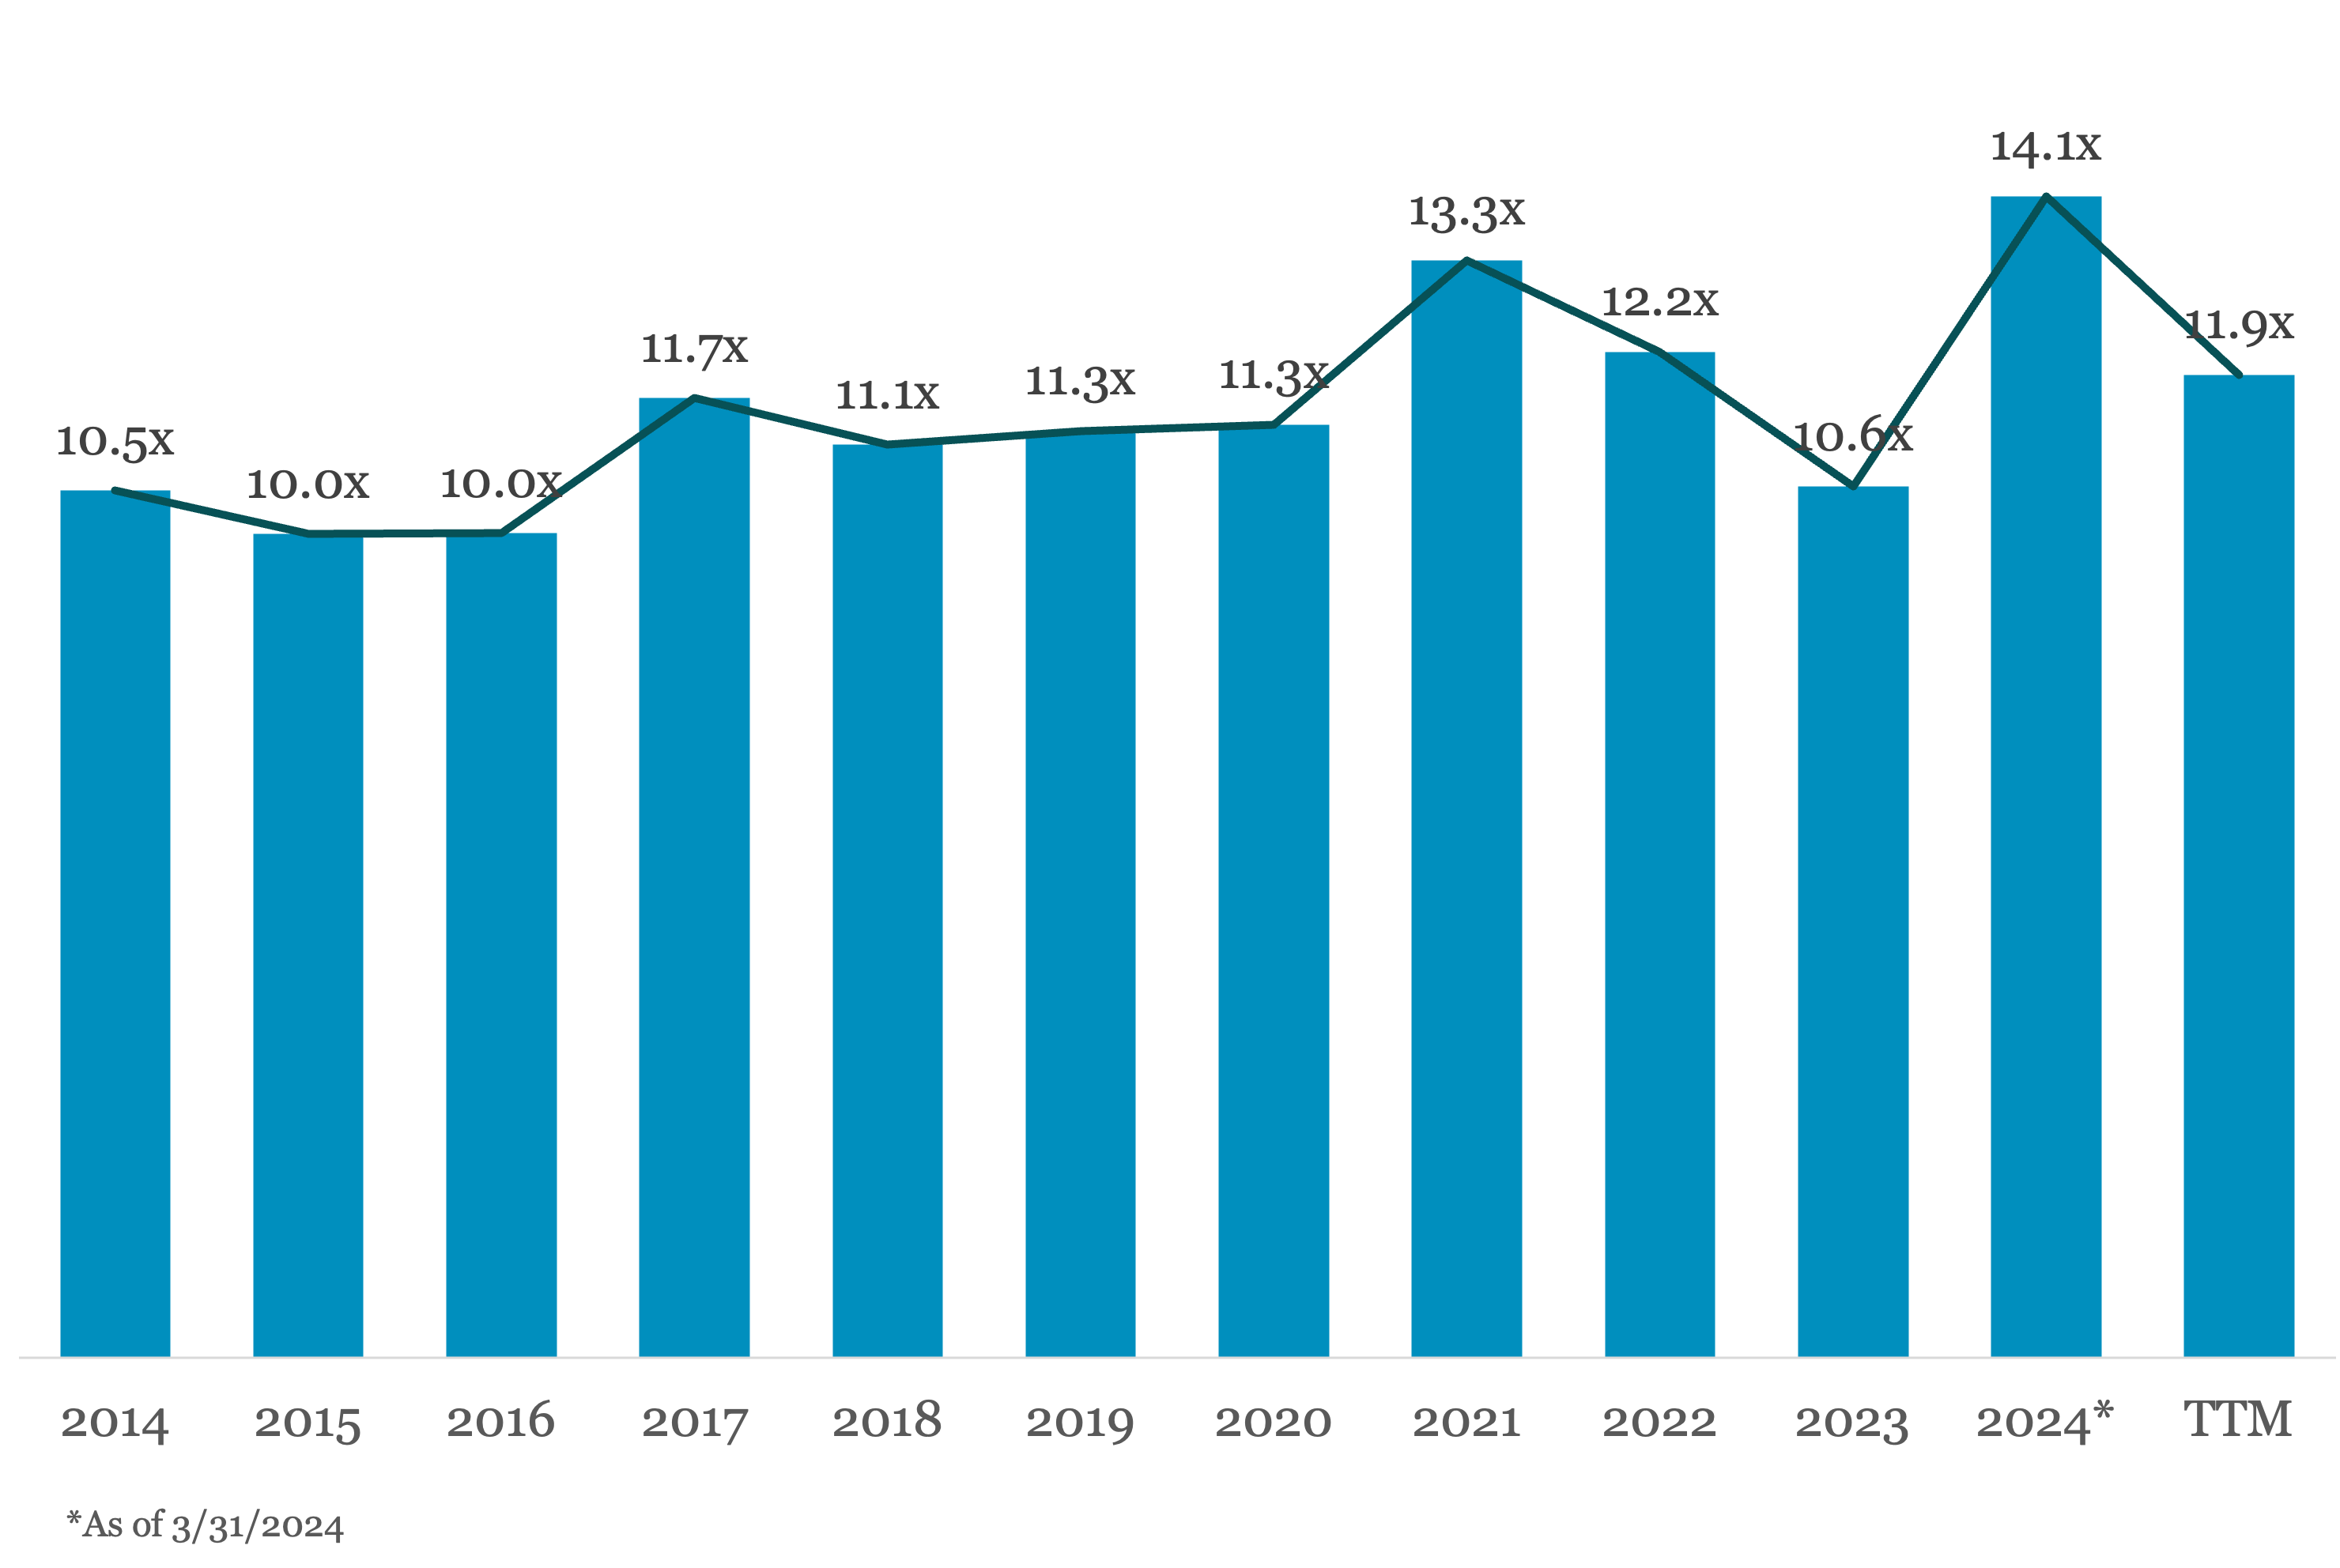
A quarter in 2024, PitchBook data shows that buyout multiples remain elevated. The trailing 12-month mark for EV/EBITDA multiples in Europe and North America stands at 11.9x, relative to 14.1x for the first quarter of 2024. It should be noted that 14.1x is surprisingly high given the volatile mix of market factors currently in play, which then prompts a caveat around the population size of said multiples being only 39. That said, for that select mix of buyouts, PE firms are clearly willing to pay up for the right targets, suggesting a combination of pressure to deploy capital, elevated dry powder, ameliorating market conditions in bringing companies to market, and ongoing positive economic data in key regions are all combining to encourage significant multiples in closing deals.
(Past performance is no guarantee of future results.)



Latest news

US Leveraged Loans Return 3.36% to Investors YTD
The Bloomberg US Leveraged Loan Index (Ticker: LOAN) returned 0.96% in August and has gained an additional 0.28% through September…

PE dry powder
The capital that is being raised is flowing overwhelmingly to the largest, most established managers.

Middle market debt held by BDCs vs High yield vs Treasury yields
The blue line represents the current dividend yield of the VanEck BDC Income ETF (BIZD), which stood at 11.7% as…