



Download PitchBook’s Report here.
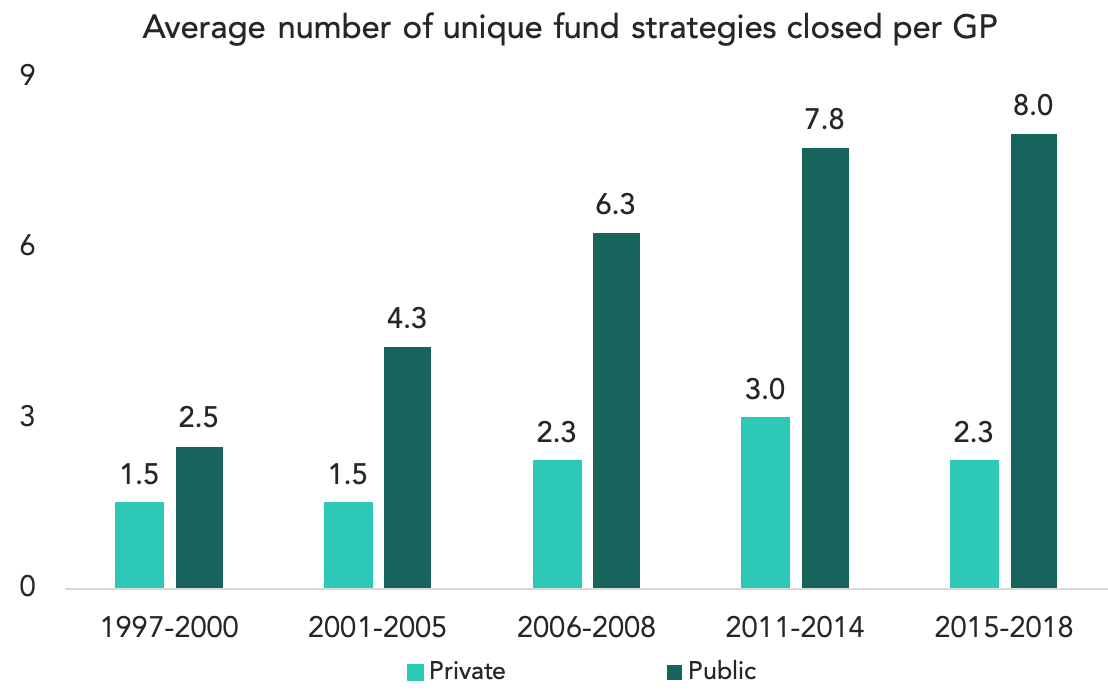
We mentioned last week that the flagship funds of public PE firms are now bigger than they were pre-crisis, while the same (mostly) can’t be said for private firms. The cynic might point out the obvious, that public firms are incentivized to raise more money because higher management fees help their stock prices. That’s true, but it’s still notable considering how many private firms have yet to reach their pre-crisis heights. Another cynical take on public firms is that they raise not just bigger funds but more funds for largely the same reason. One interesting tidbit from our recent analyst note, however, is that today’s now-public firms were actually diversifying decades before they IPO’d. The more-strategies strategy has been in their DNA for a while.
Starting in the late 90s, the firms that would eventually go public had, on average. 2.5 unique fund strategies to their name, compared to only 1.5 for the private cohort. By 2001-2005, when the PE market really got rolling, the firms that eventually went public had an average of 4.3 strategies, while the four private firms stayed put at 1.5. At the fever pitch of 2006-2008, the difference swelled 6.3 to 2.3, while today’s gap is even starker at 8.0 to 2.3. Firms like Blackstone and KKR are getting closer to becoming asset managers rather than mere buyout shops. None of which is to say that fund diversification is the gold standard, and other firms are somehow less worthwhile because they only do bread-and-butter buyouts. Just the opposite sometimes: Many LPs value focused strategies, as long as they can get into one of them.



Latest news

US Leveraged Loans Return 3.36% to Investors YTD
The Bloomberg US Leveraged Loan Index (Ticker: LOAN) returned 0.96% in August and has gained an additional 0.28% through September…

PE dry powder
The capital that is being raised is flowing overwhelmingly to the largest, most established managers.

Middle market debt held by BDCs vs High yield vs Treasury yields
The blue line represents the current dividend yield of the VanEck BDC Income ETF (BIZD), which stood at 11.7% as…