



Download PitchBook’s Report here.
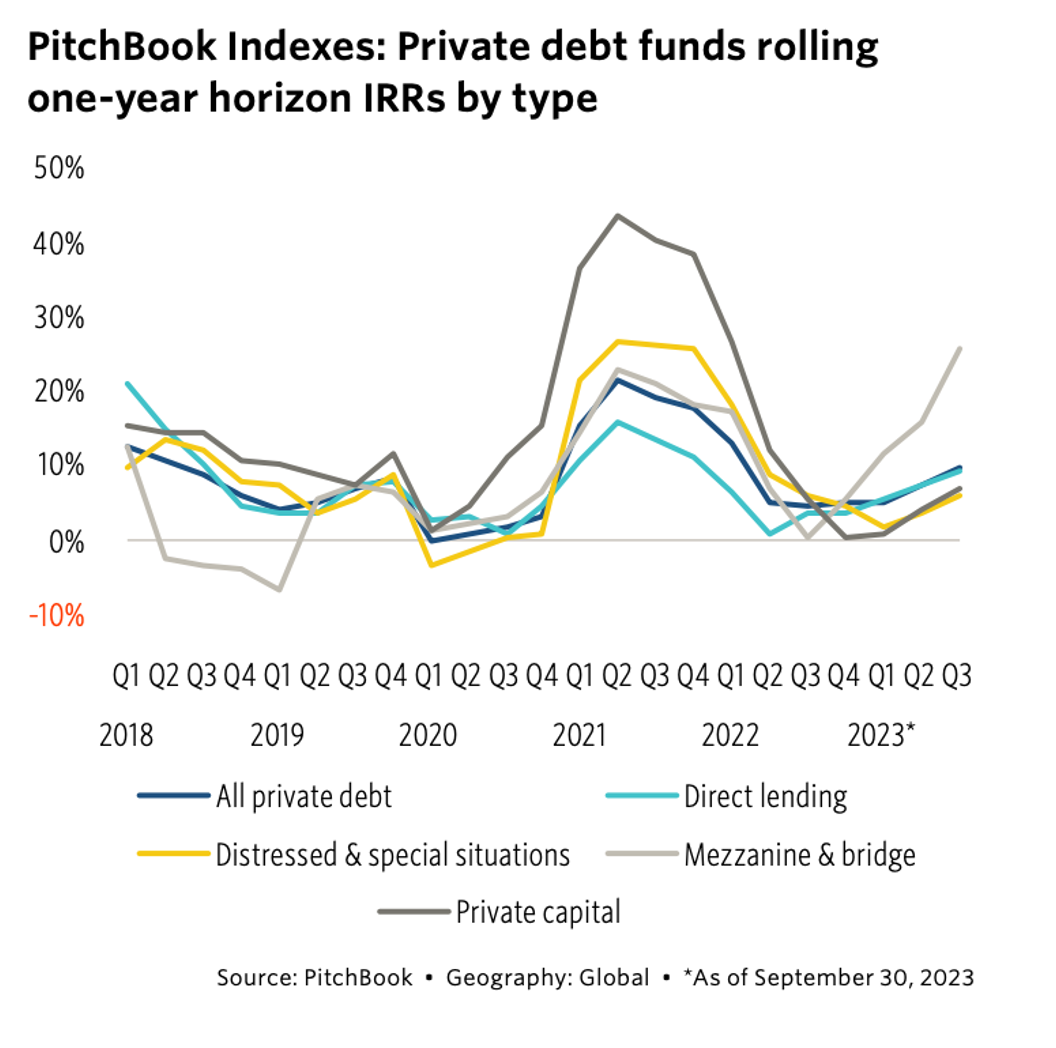
It was another stellar quarter for floating-rate loans to private company borrowers, which represent the bulk of private debt fund holdings. A good proxy for how these loans performed, the US Morningstar LSTA Index gained 2.5% in Q1 2024. This was more than double the 1.2% historic average return for the first quarter of the year. This follows a 13.4% return delivered by the LSTA Index in 2023, which is the highest annual reading since the global financial crisis and the second highest ever. These persistently high yields explain the continued attraction and strong relative performance of private debt funds. Many are originating loans at yields that are equal to or higher than the bank-led syndicated market. Our analysis of public business development company holdings, another close proxy for private debt funds, reveals that roughly 70% of private credit loans yield 11% or greater versus approximately 25% of syndicated loans. As a result, private debt continues to move up the performance scales relative to other private capital strategies and asset classes that are more adversely affected by a “higher for longer” interest rate environment, with a one-year horizon return of 9.8% through Q3 2023 and a preliminary Q4 2023 quarterly return of 3.6%.
(Past performance is no guarantee of future results.)





Latest news

Rate hike expectations ease as term SOFR curve flattens
The CME six-month Term SOFR rate reached a recent high of 3.979% on July 28 before retreating to 3.837% as…

3Q26: New loan assets rise to 44% of total lending, a 3-year high
New loan assets as a proportion of total US loan volume make up 44% of the 3Q26 pipeline to date,…

North American GPs dominant as fundraising accelerates
Our PEI Private Credit 200 ranking also shows capital raising increasing overall – and accelerating especially fast for the largest…