



Canada Keeps Climbing
Canadian PE activity put together another solid first quarter, amassing about C$8 billion through 63 deals to start 2015. Both totals are slight declines YoY, but on the whole activity has remained robust. A whopping 70% of 1Q buyouts were add-on investments, which should come down as the year progresses. Still, Canada has been ahead of the curve vis-à-vis add-ons since around 2008, when 52% of all buyouts were of the buy-and-build variety. The U.S. market didn’t crack the 50% mark until 2011.
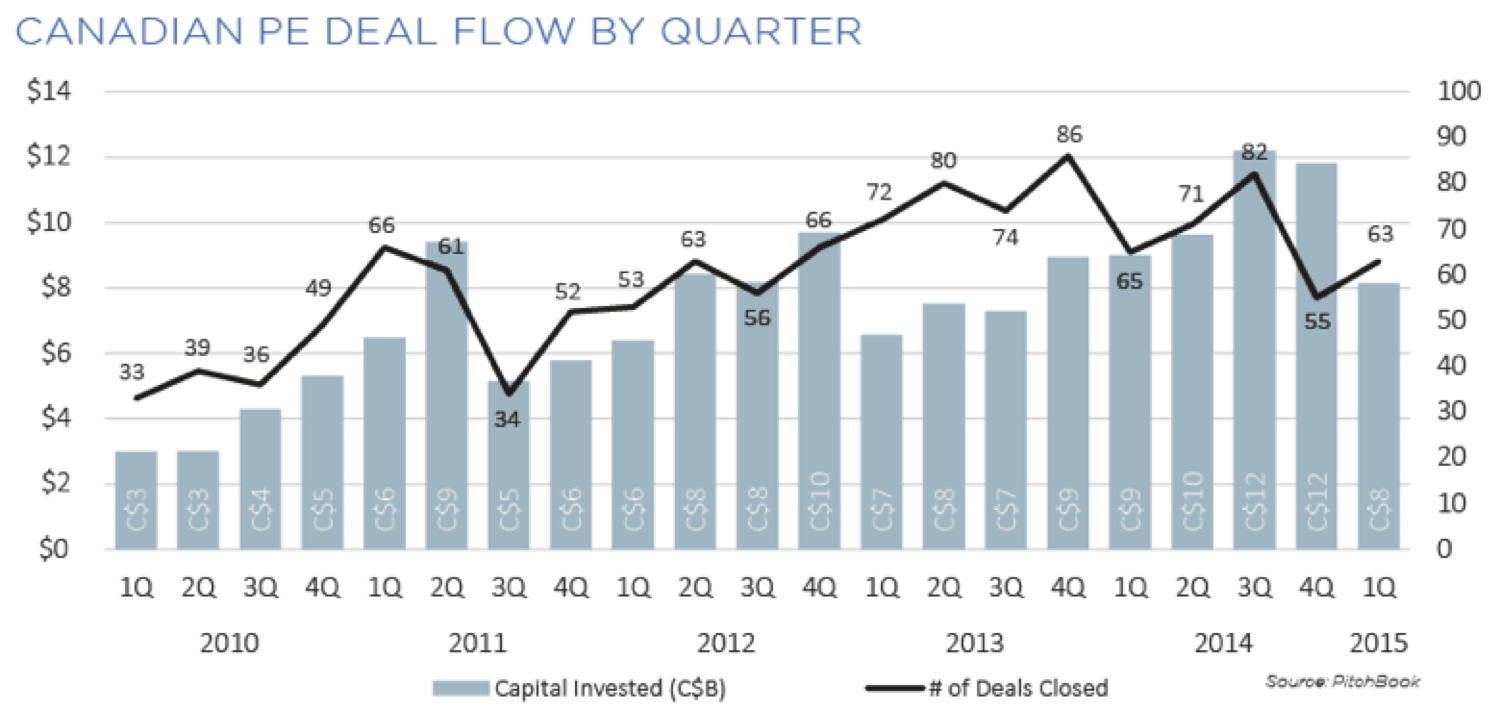
Canada recovered much more quickly from the financial crisis than the U.S. did, at least from a PE perspective. Between 1Q2010 and 4Q2014, Canadian activity popped 148% on a deal flow basis versus a respectable 40% in the states. Much of that is credited to Canada’s banking system, which survived the crisis fairly intact. No major banks failed and leverage use was more highly regulated. Which makes us wonder if the Canadian “recovery” has even more room to grow relative to the U.S. market, which sees an interest rate hike on the horizon.
Contact: Alex Lykken
alex.lykken@pitchbook.com



Latest news

US Leveraged Loans Return 3.36% to Investors YTD
The Bloomberg US Leveraged Loan Index (Ticker: LOAN) returned 0.96% in August and has gained an additional 0.28% through September…

PE dry powder
The capital that is being raised is flowing overwhelmingly to the largest, most established managers.

Middle market debt held by BDCs vs High yield vs Treasury yields
The blue line represents the current dividend yield of the VanEck BDC Income ETF (BIZD), which stood at 11.7% as…