



Download PitchBook’s Report here.
At the outset of the quarantines, at least one market observer—yours truly—believed add-ons would hit the pause button after two torrid years of deal flow. The assumption: it was hard to imagine too many add-ons being done when existing portfolio companies had so many sudden issues of their own. Any acquisition typically takes several months to complete, and healthcare officials were penciling in several months of quarantines ahead. Why add more uncertainty to the mix, especially when add-ons frequently turn sour even in the best of times?
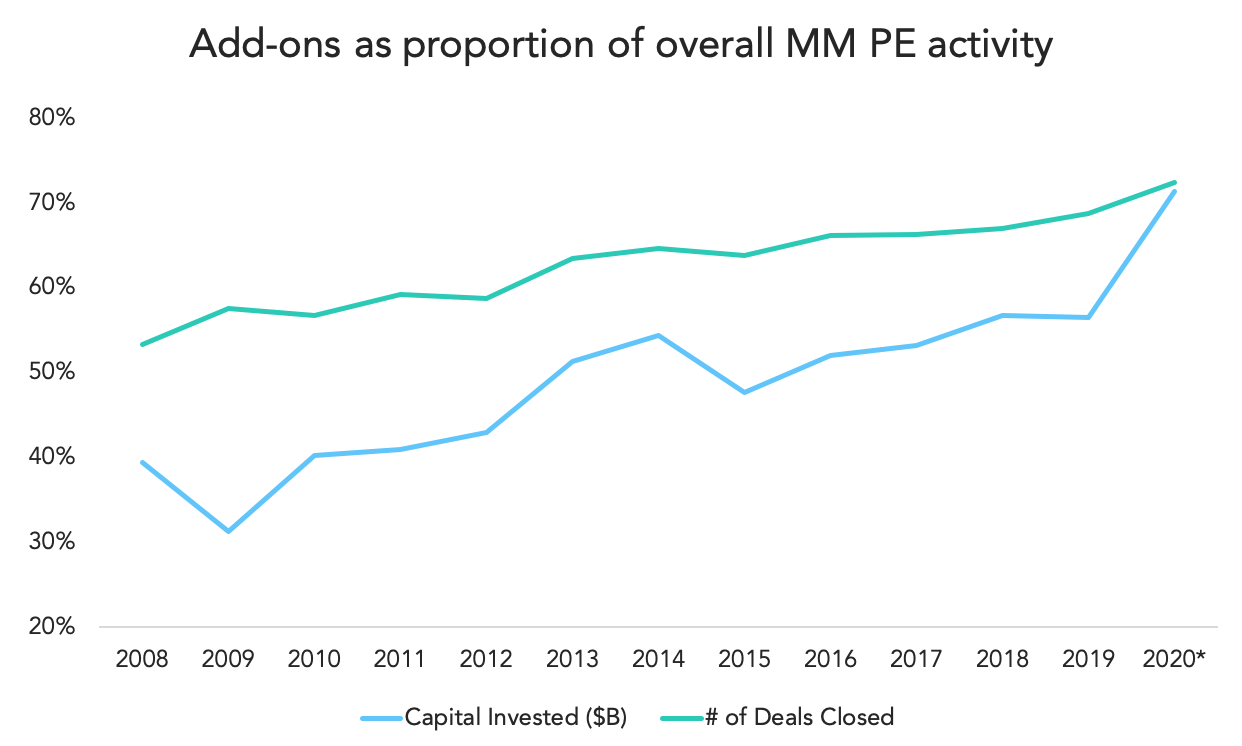
The middle market didn’t agree. According to PitchBook’s latest US PE Middle Market Report, Q1 add-ons accounted for the highest percentage of capital invested in the industry’s history. Through the first quarter at least, an estimated 71% of all PE dollars went toward add-ons, while almost 73% of all Q1 transactions were add-ons compared to platform buyouts. By comparison, only 56.6% of all 2019 dollars went to add-ons, an almost 15 percentage point swing. Of course, that ratio is partially boosted by the fact that LBOs came to a halt in March. The denominator got a lot smaller, in other words. But the numerator—add-on volume—was relatively intact. 469 were done in Q1 totaling an approximate $70.1 billion. Neither figure is too far off 2019’s pace, which saw 2,264 done for a combined $269.6 billion. By the end of 2020, add-on totals may be the closest of all PE datapoints to historical numbers.
Market share is up for grabs, and many portfolio companies are starting to look ahead 6, 12, 18 months down the road. While sponsors undoubtedly see new platform opportunities on the horizon, they are intimately aware of how their existing companies are performing and how they can prepare them post-COVID. The numbers suggest they can walk and chew gum at the same time.




Latest news
Q2'26 BDC analysis shows additional 184 bps of nonaccruals at cost
In a universe of 173 business development companies, or BDCs, Octus identified a total of $9.5 billion of debt (at cost) in nonaccrual status reported in the second quarter of 2026, a slight decline of 5% from $10 billion in the first quarter of 2026.

Reading the Board
The story changes depending on which numbers you’re counting.
Private Credit Defaults 101: Different Numbers, Different Stories
In Season 2 of Billions, Bobby Axelrod takes his lawyer Orrin Bach to an empty Yonkers racetrack in the dead of night.