


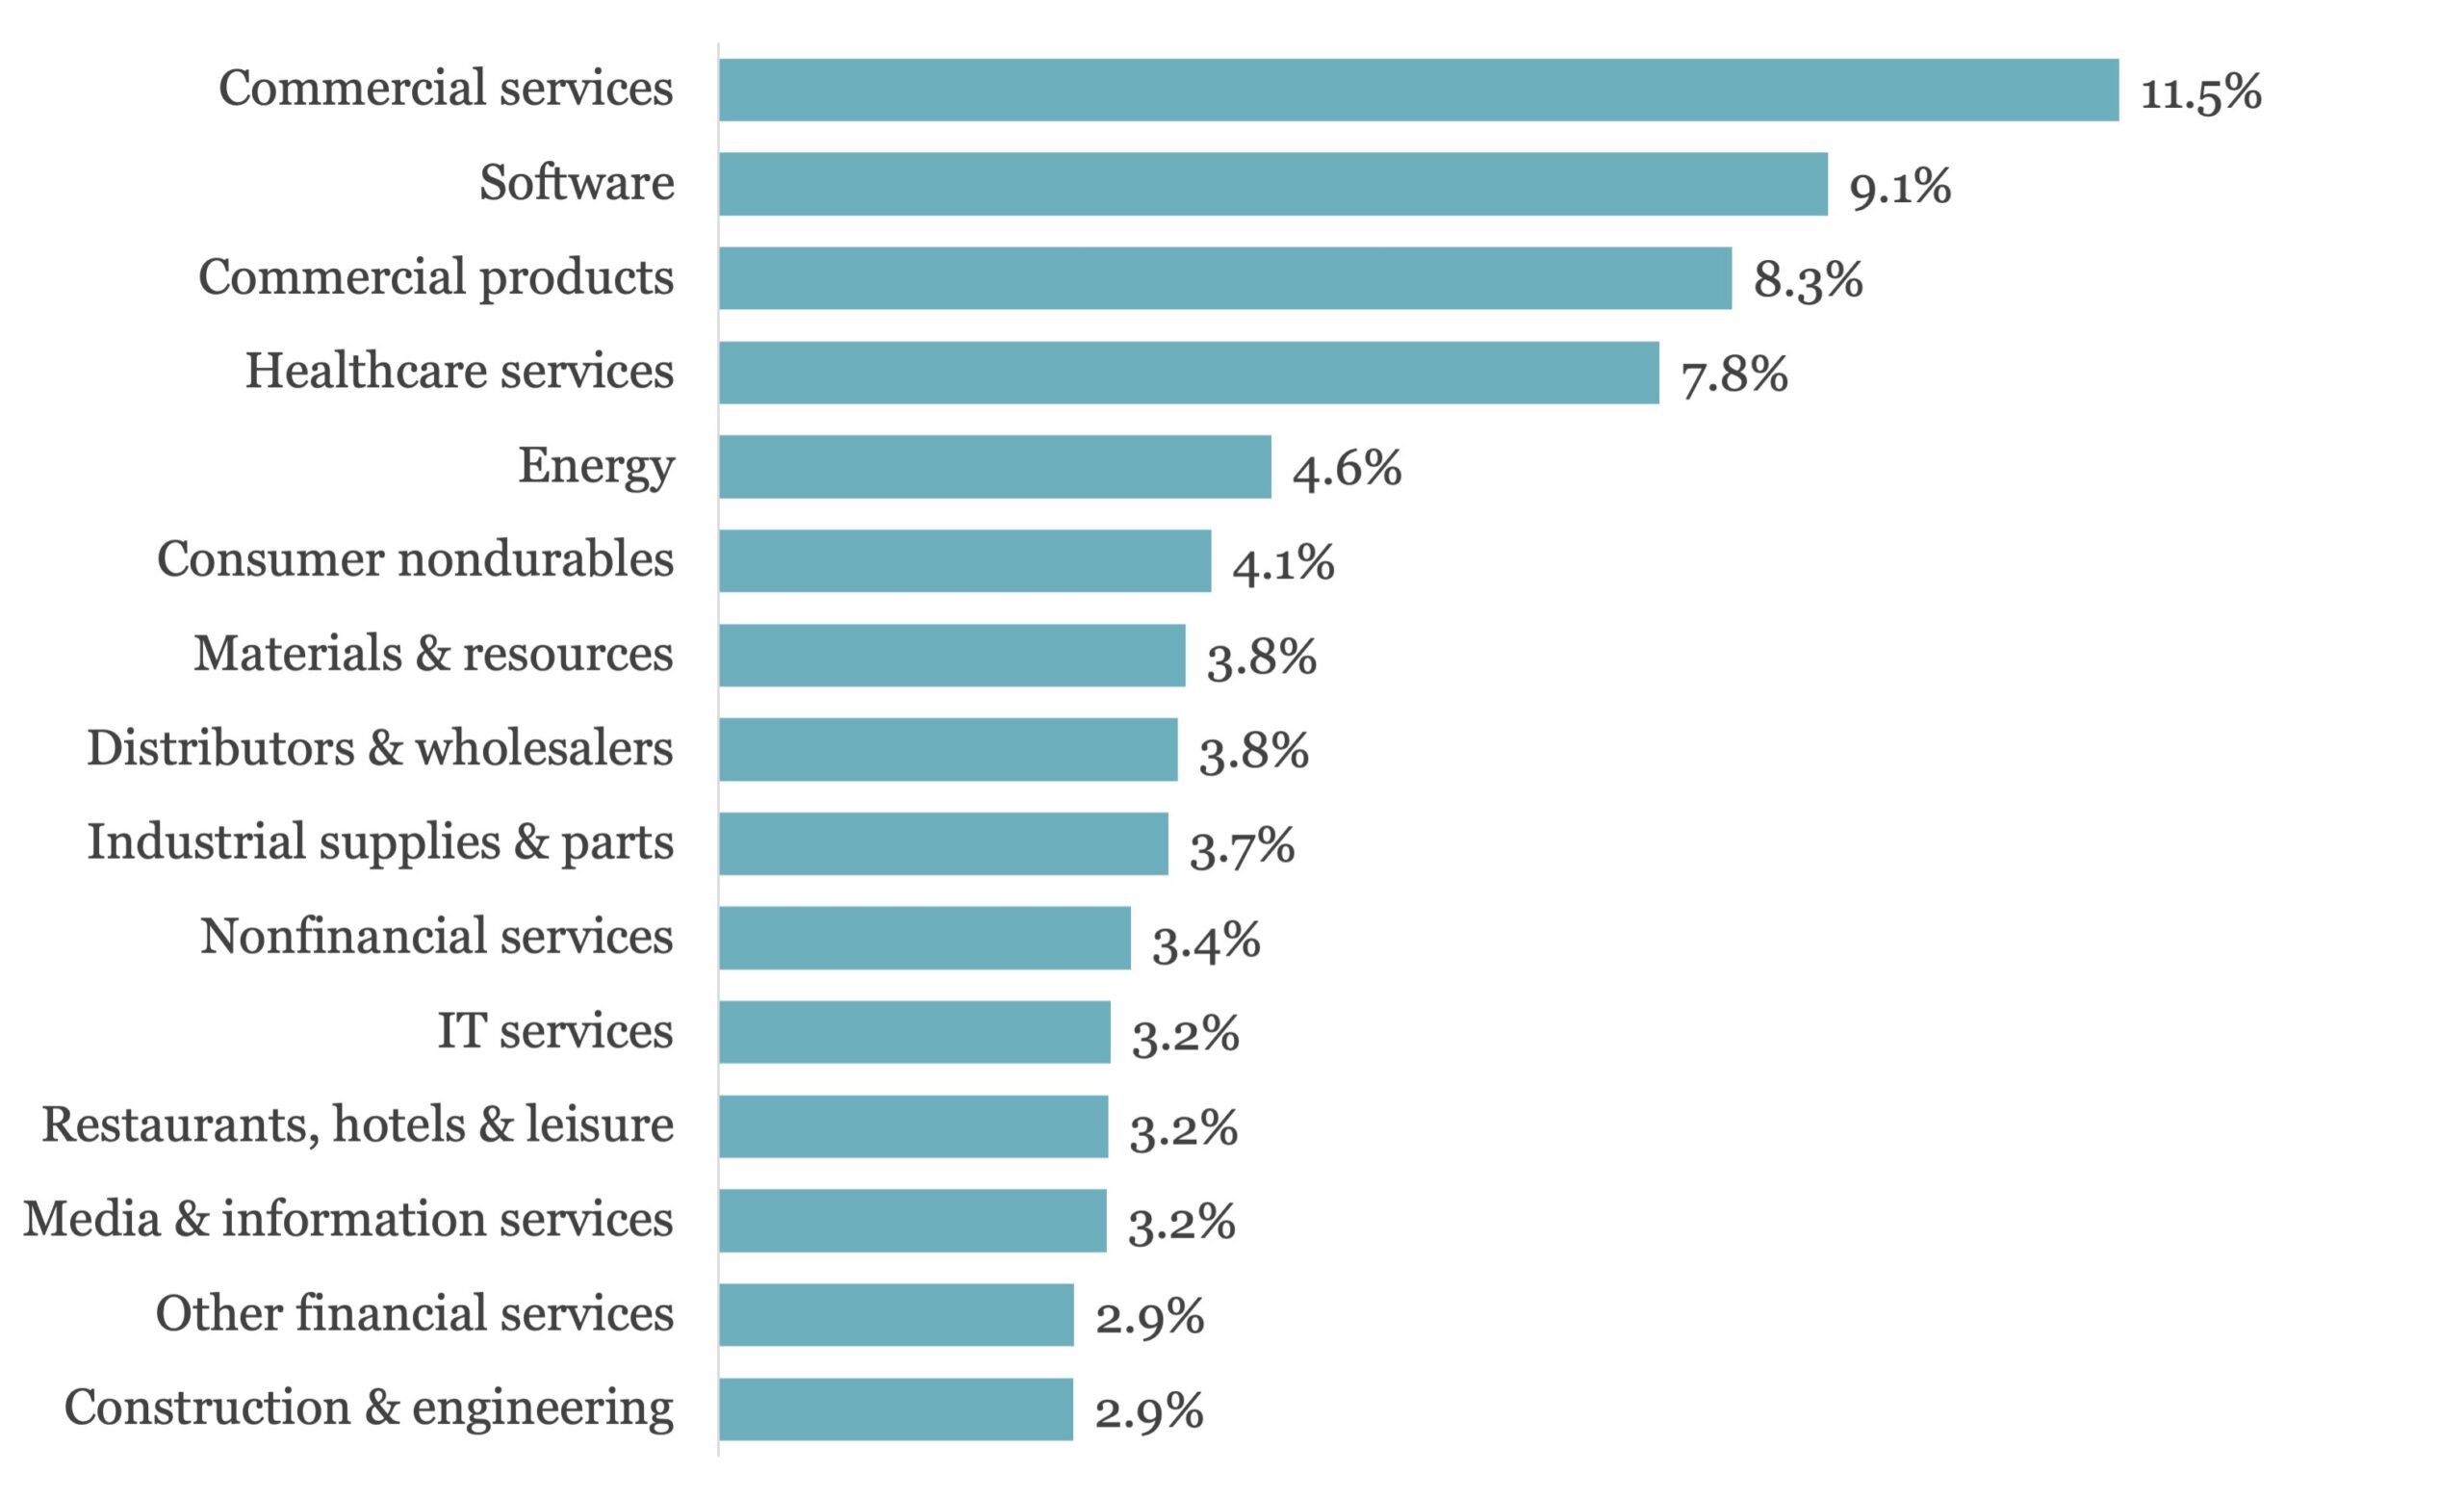
Share of buyout inventory by industry (top 15)

PB icon
Content hub / Article / PitchBook / Share of buyout inventory by industry (top 15)


Download PitchBook’s ReportĀ here.

A clear concentration of buyout inventory resides in four sectors: software, commercial products and services, and healthcare services. That is due in large part to the particular traits of PE operating theses converging with those sectors’ specific dynamics and recent macro trends. Given the concentration in services, PE portfolios may be somewhat more insulated from tariffs as well, but some concerns are still likely due to ripple effects on the overall economy once the impact of tariffs and any economic slowdown are felt more intensely.

(Past performance is no guarantee of future results.)

2026 Private Credit Investor Survey

Share your perspective

2026 Private Credit Investor Survey

Institutional investors, RIAs and financial advisors - we want to hear from you. Take this two-minute anonymous survey and receive the results report.
Take the survey
US Private Credit League Tables 9M'26

Report

US Private Credit League Tables 9M'26

The definitive rankings covering private credit activity in 9M'26.
Download
LSEG LPC's Large Corporate Leveraged & Middle Market Loans Conference

NYC | October 29, 2026

LSEG LPC's Large Corporate Leveraged & Middle Market Loans Conference

Join 250 delegates for a full day of insightful discussions on the most pressing issues facing the loan market.
Learn more
PitchBook's H1 2026 Global Private Debt Report

Report

PitchBook's H1 2026 Global Private Debt Report

Strong fundamentals, but uncertainty remains.
Download

Latest news

    US leveraged loans returns turn negative in October

    The Bloomberg US Leveraged Loan Index (Ticker: LOAN) has returned -0.26% this month through October 21, reducing its year-to-date return…

    Read More

    M&A activity begins to tick upward

    In the third quarter of 2026, acquisition-linked loan volume across North America and Europe reached about $47 billion, up from $30.6 billion in Q2 and $29.5 billion a year ago.

    Read More

    High-Yield Bond Statistics

    Read More



