



Download PitchBook’s Report here.
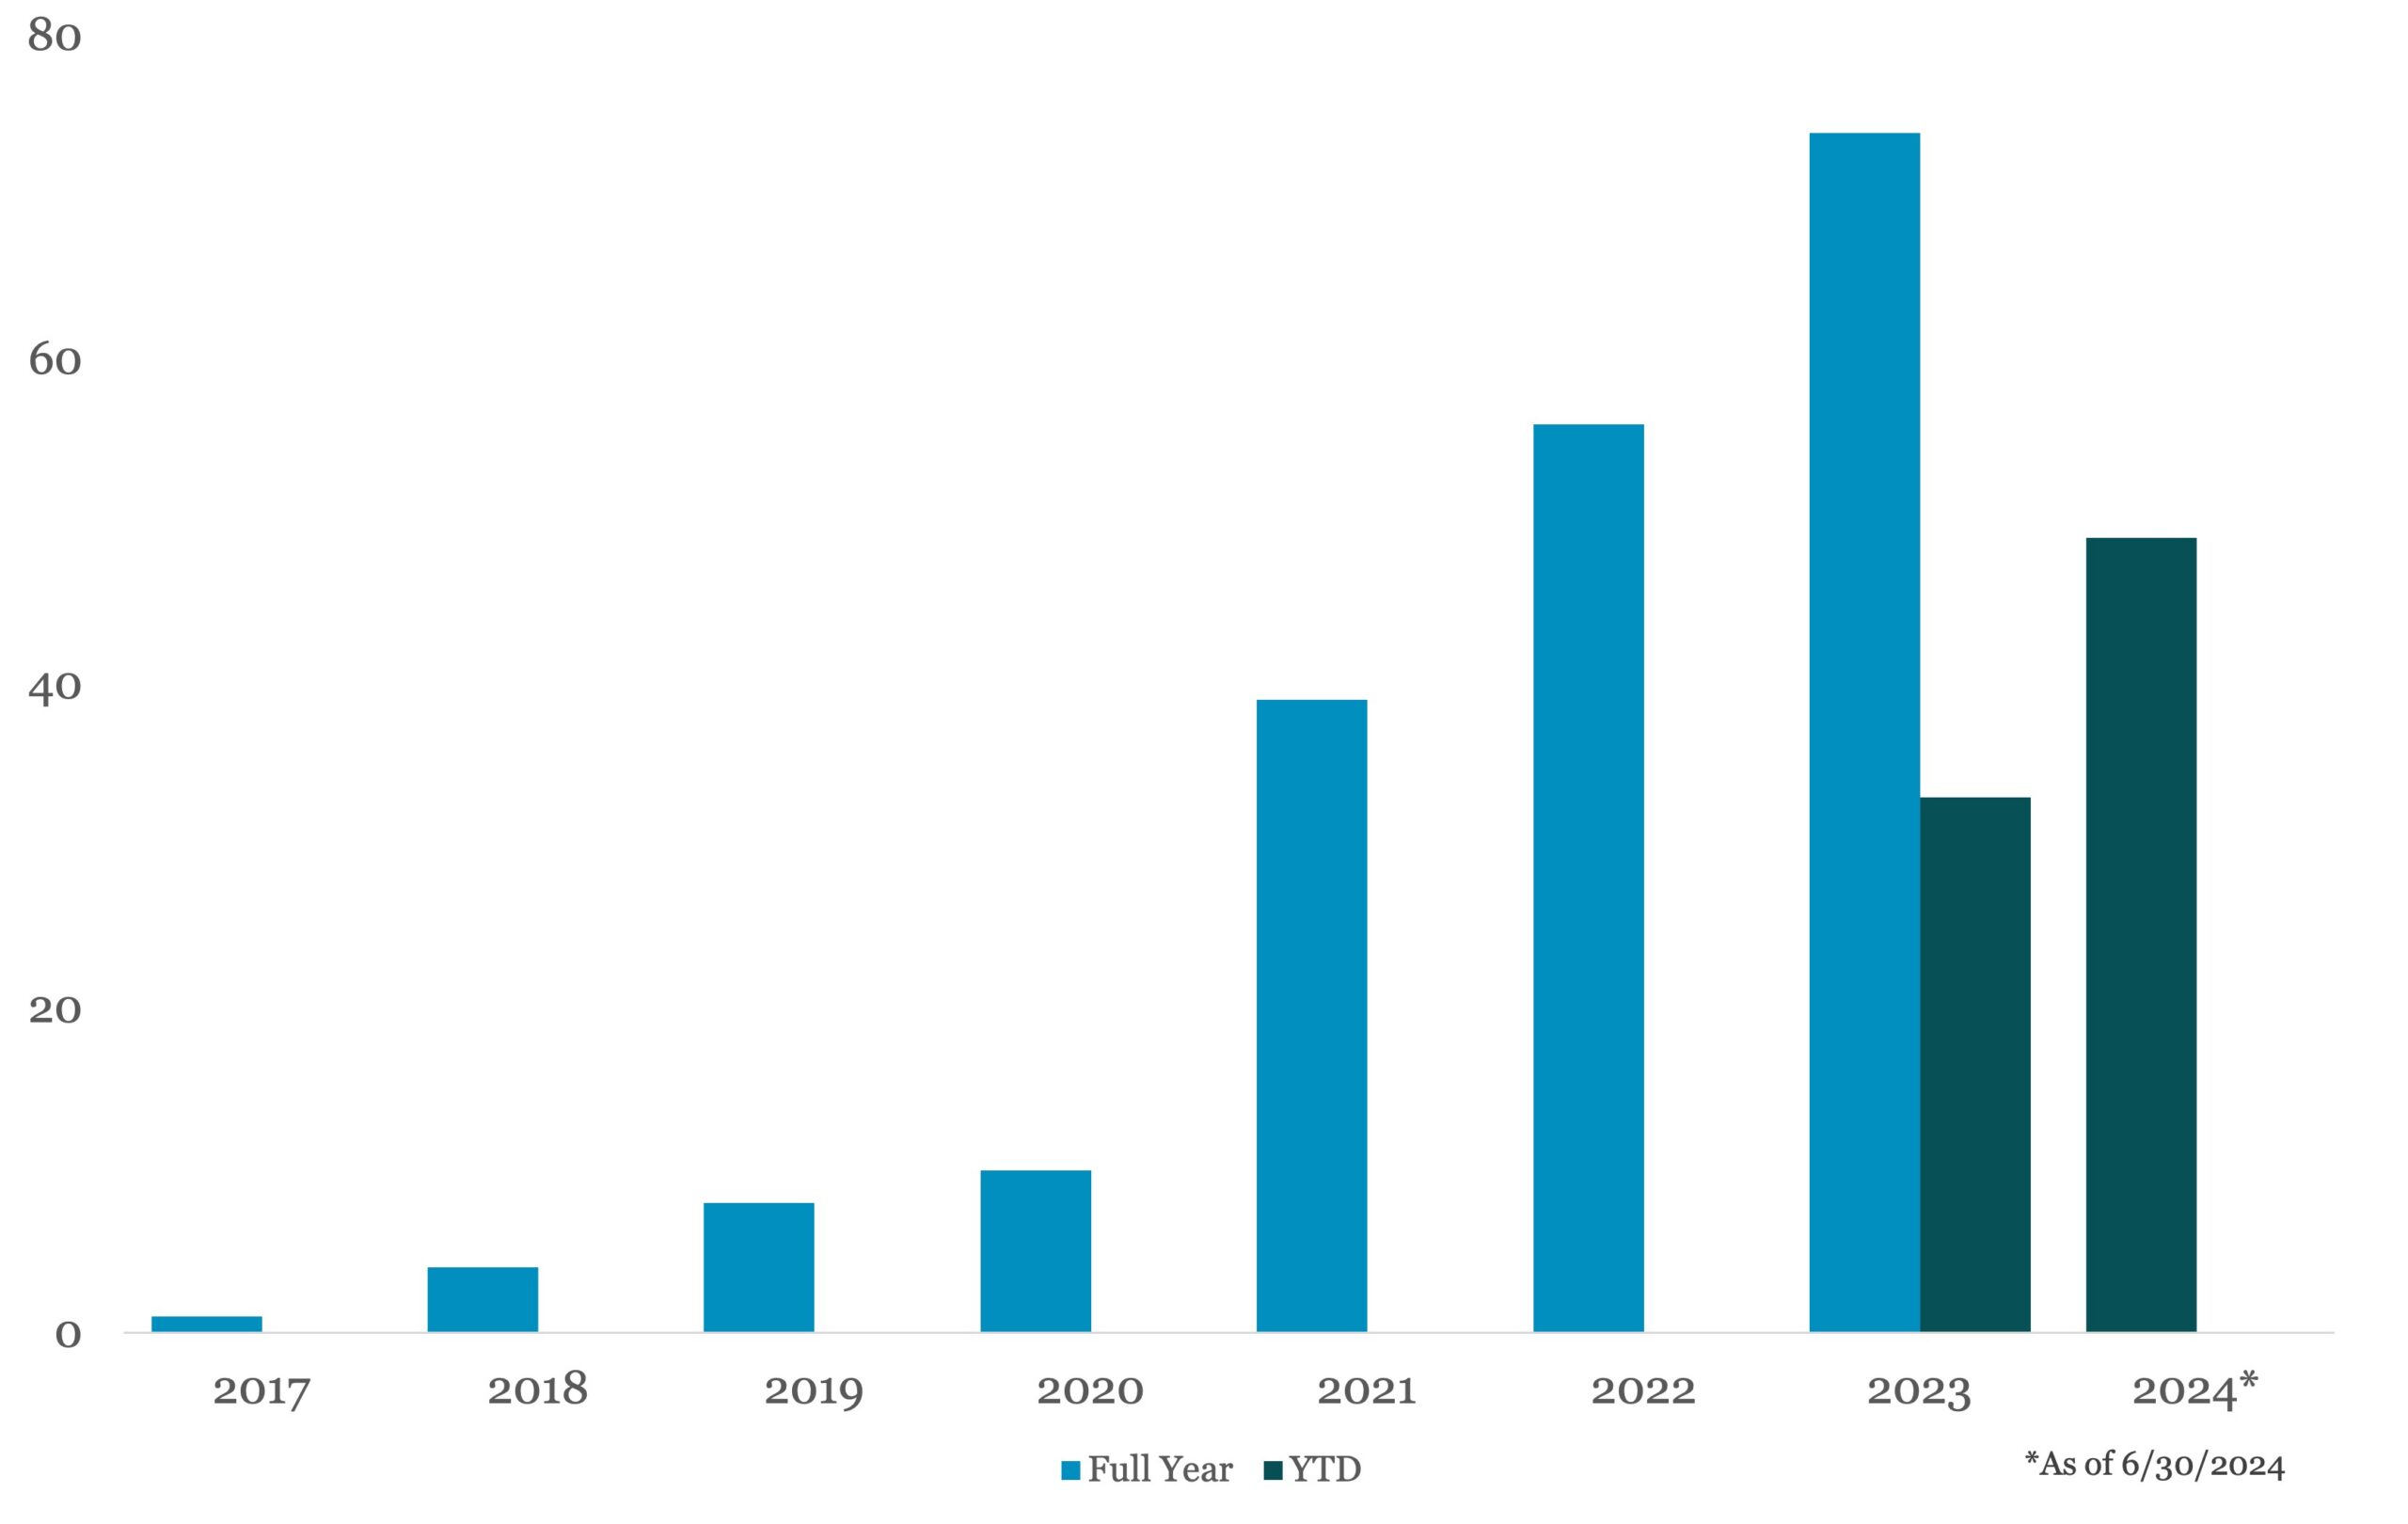
Looking ahead, the forces driving the recent acceleration in continuation funds remain in place. Traditional M&A and IPO exits recovered in H1 2024 but only modestly so. They remain well below historical averages relative to AUM and the 23,300 companies accumulated by PE funds in North America and Europe. Meanwhile, new money flowing to strategies that invest in LP- and GP-led secondaries, including continuation vehicles, continues to build. Total committed capital for funds closed in the trailing 12-month (TTM) period ending Q1 2024 topped $83.6 billion, a 48.3% gain over the prior year. In Q1 alone, an impressive $29.4 billion was raised by secondaries-focused funds. We would not be surprised to see the fundraising gap between primary and secondary PE strategies narrow significantly in H2 2024.
(Past performance is no guarantee of future results.)



Latest news

US Leveraged Loans Return 3.36% to Investors YTD
The Bloomberg US Leveraged Loan Index (Ticker: LOAN) returned 0.96% in August and has gained an additional 0.28% through September…

PE dry powder
The capital that is being raised is flowing overwhelmingly to the largest, most established managers.

Middle market debt held by BDCs vs High yield vs Treasury yields
The blue line represents the current dividend yield of the VanEck BDC Income ETF (BIZD), which stood at 11.7% as…