



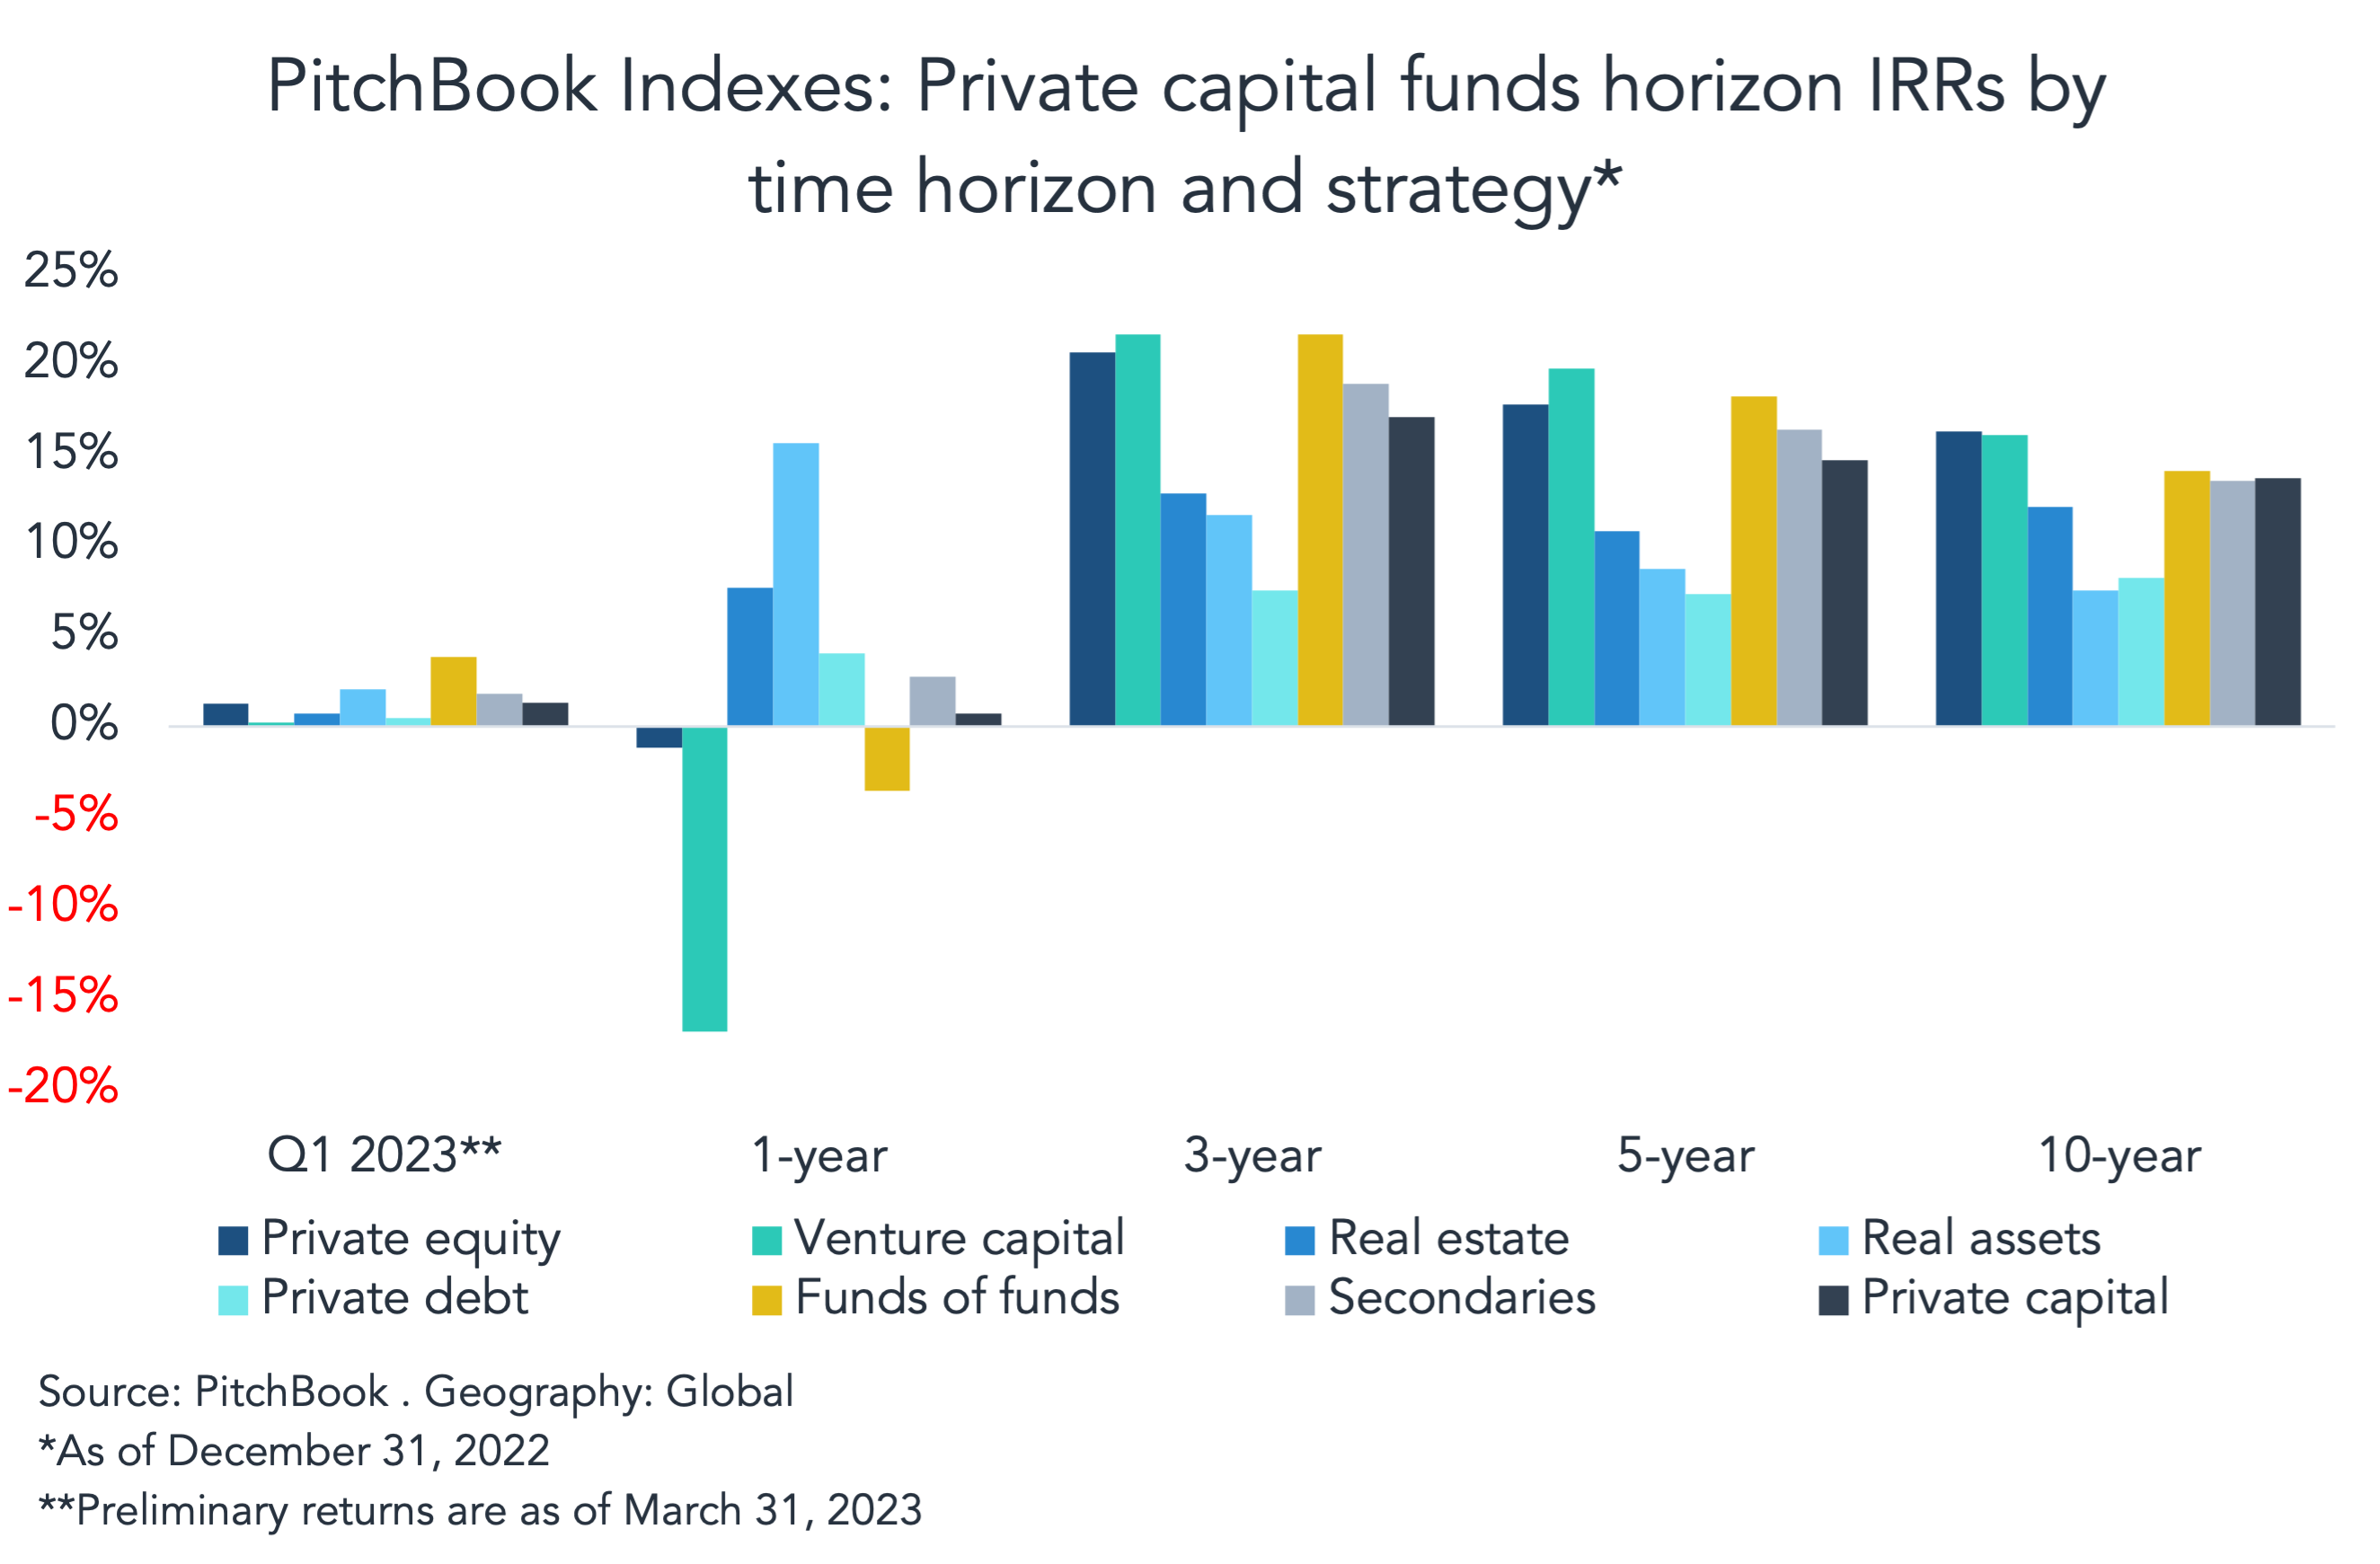
Given the tumultuous market environment of the past 18 months and counting, how are the latest private capital returns looking? With preliminary data as of the end of March of this year, PitchBook’s latest performance figures help both confirm classic traits of private capital strategies’ performance while also presenting some interesting suppositions to contemplate. Charting out horizon internal rates of return (IRRs) across private strategies, it is clear that there is gradual performance convergence to some degree over time among some asset class clusters. For example, at the 10-year horizon, funds-of-funds and secondaries converge with private capital overall, after a peak at the three-year horizon and slight decrease at the five-year mark. Fascinatingly, real assets show the only significant, quick change in performance, with their one-year horizon IRRs likely juiced by a uniquely volatile energy environment in the past couple of years that enabled lucrative sales and asset divestitures. Venture suffered a significant drawdown primarily due to the moribund exit market in that same timeframe.
From there, however, what may be one of the more striking findings is the lack of surprise. Private capital returns are still robust though increasingly in question relative to competitive public equities. However, convergence or lack of change across performance horizons is not that substantial. PE for example benefits more from lack of a decline in the short term, but eventually converges with venture, its closest counterpart in some ways – both remain sufficiently strong that their record capital overhang seems unlikely to dwindle much. Private credit remains consistent regardless of horizon, but lower than funds-of-funds. Each asset class’s traits of illiquidity are reflected, as are their respective J-curves. In short, depending on the income and time horizons of the allocators involved, the biggest open question for private capital returns is to what degree their degree of outperformance justify their expenses.
(Past performance is no guarantee of future results.)




Latest news


PE fund distribution rates
Following 2021, buyout distribution rates have fallen to roughly 10% to 15% below the 25-year average.

Sub line pricing flattens
A report on the topic also finds that investors are less concerned by leverage in NAV loans. Pricing for subscription…