



It’s become common knowledge (and maybe conventional wisdom) that PE buyers are much more disciplined today than they were in 2007. One useful comparison is the amount of PE capital spent versus the amount raised. Going back to 2011, note the correlation between the two totals and how little they deviate from one another. This suggests that deal flow is much more stable than it was in 2007, when PEGs invested close to $1 trillion on top of a relatively paltry $294 billion raised. It’s true that a number of mega-deals skewed those numbers, but it’s also true that the debt markets played a much bigger role ten years ago than they do today. In other words, the amount of fresh dry powder raised by PEGs is more closely tied to their deal flow post-crisis.
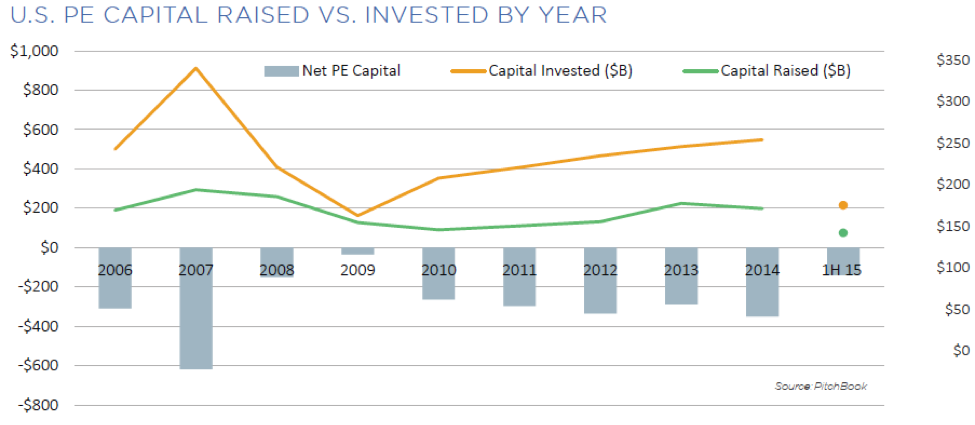
One takeaway from this chart is that, despite near-record deal flow and a buoyant lending market, the differences between 2015 and 2007 are visible. It’s hard to argue we’re in the middle of a 2007 redux when the largest difference in capital invested vs. raised was -$350 billion last year, a long shot from the -$617.5 billion difference in 2007. So far this year, the dichotomy is mild at -$140.9 billion. If fundraising continues apace and deal activity slows, as we expect, 2015 will see the smallest difference between cap invested vs. raised since 2009.
Contact: Alex Lykken
alex.lykken@pitchbook.com





Latest news

Rate hike expectations ease as term SOFR curve flattens
The CME six-month Term SOFR rate reached a recent high of 3.979% on July 28 before retreating to 3.837% as…

3Q26: New loan assets rise to 44% of total lending, a 3-year high
New loan assets as a proportion of total US loan volume make up 44% of the 3Q26 pipeline to date,…

North American GPs dominant as fundraising accelerates
Our PEI Private Credit 200 ranking also shows capital raising increasing overall – and accelerating especially fast for the largest…