



Download PitchBook’s Report here.
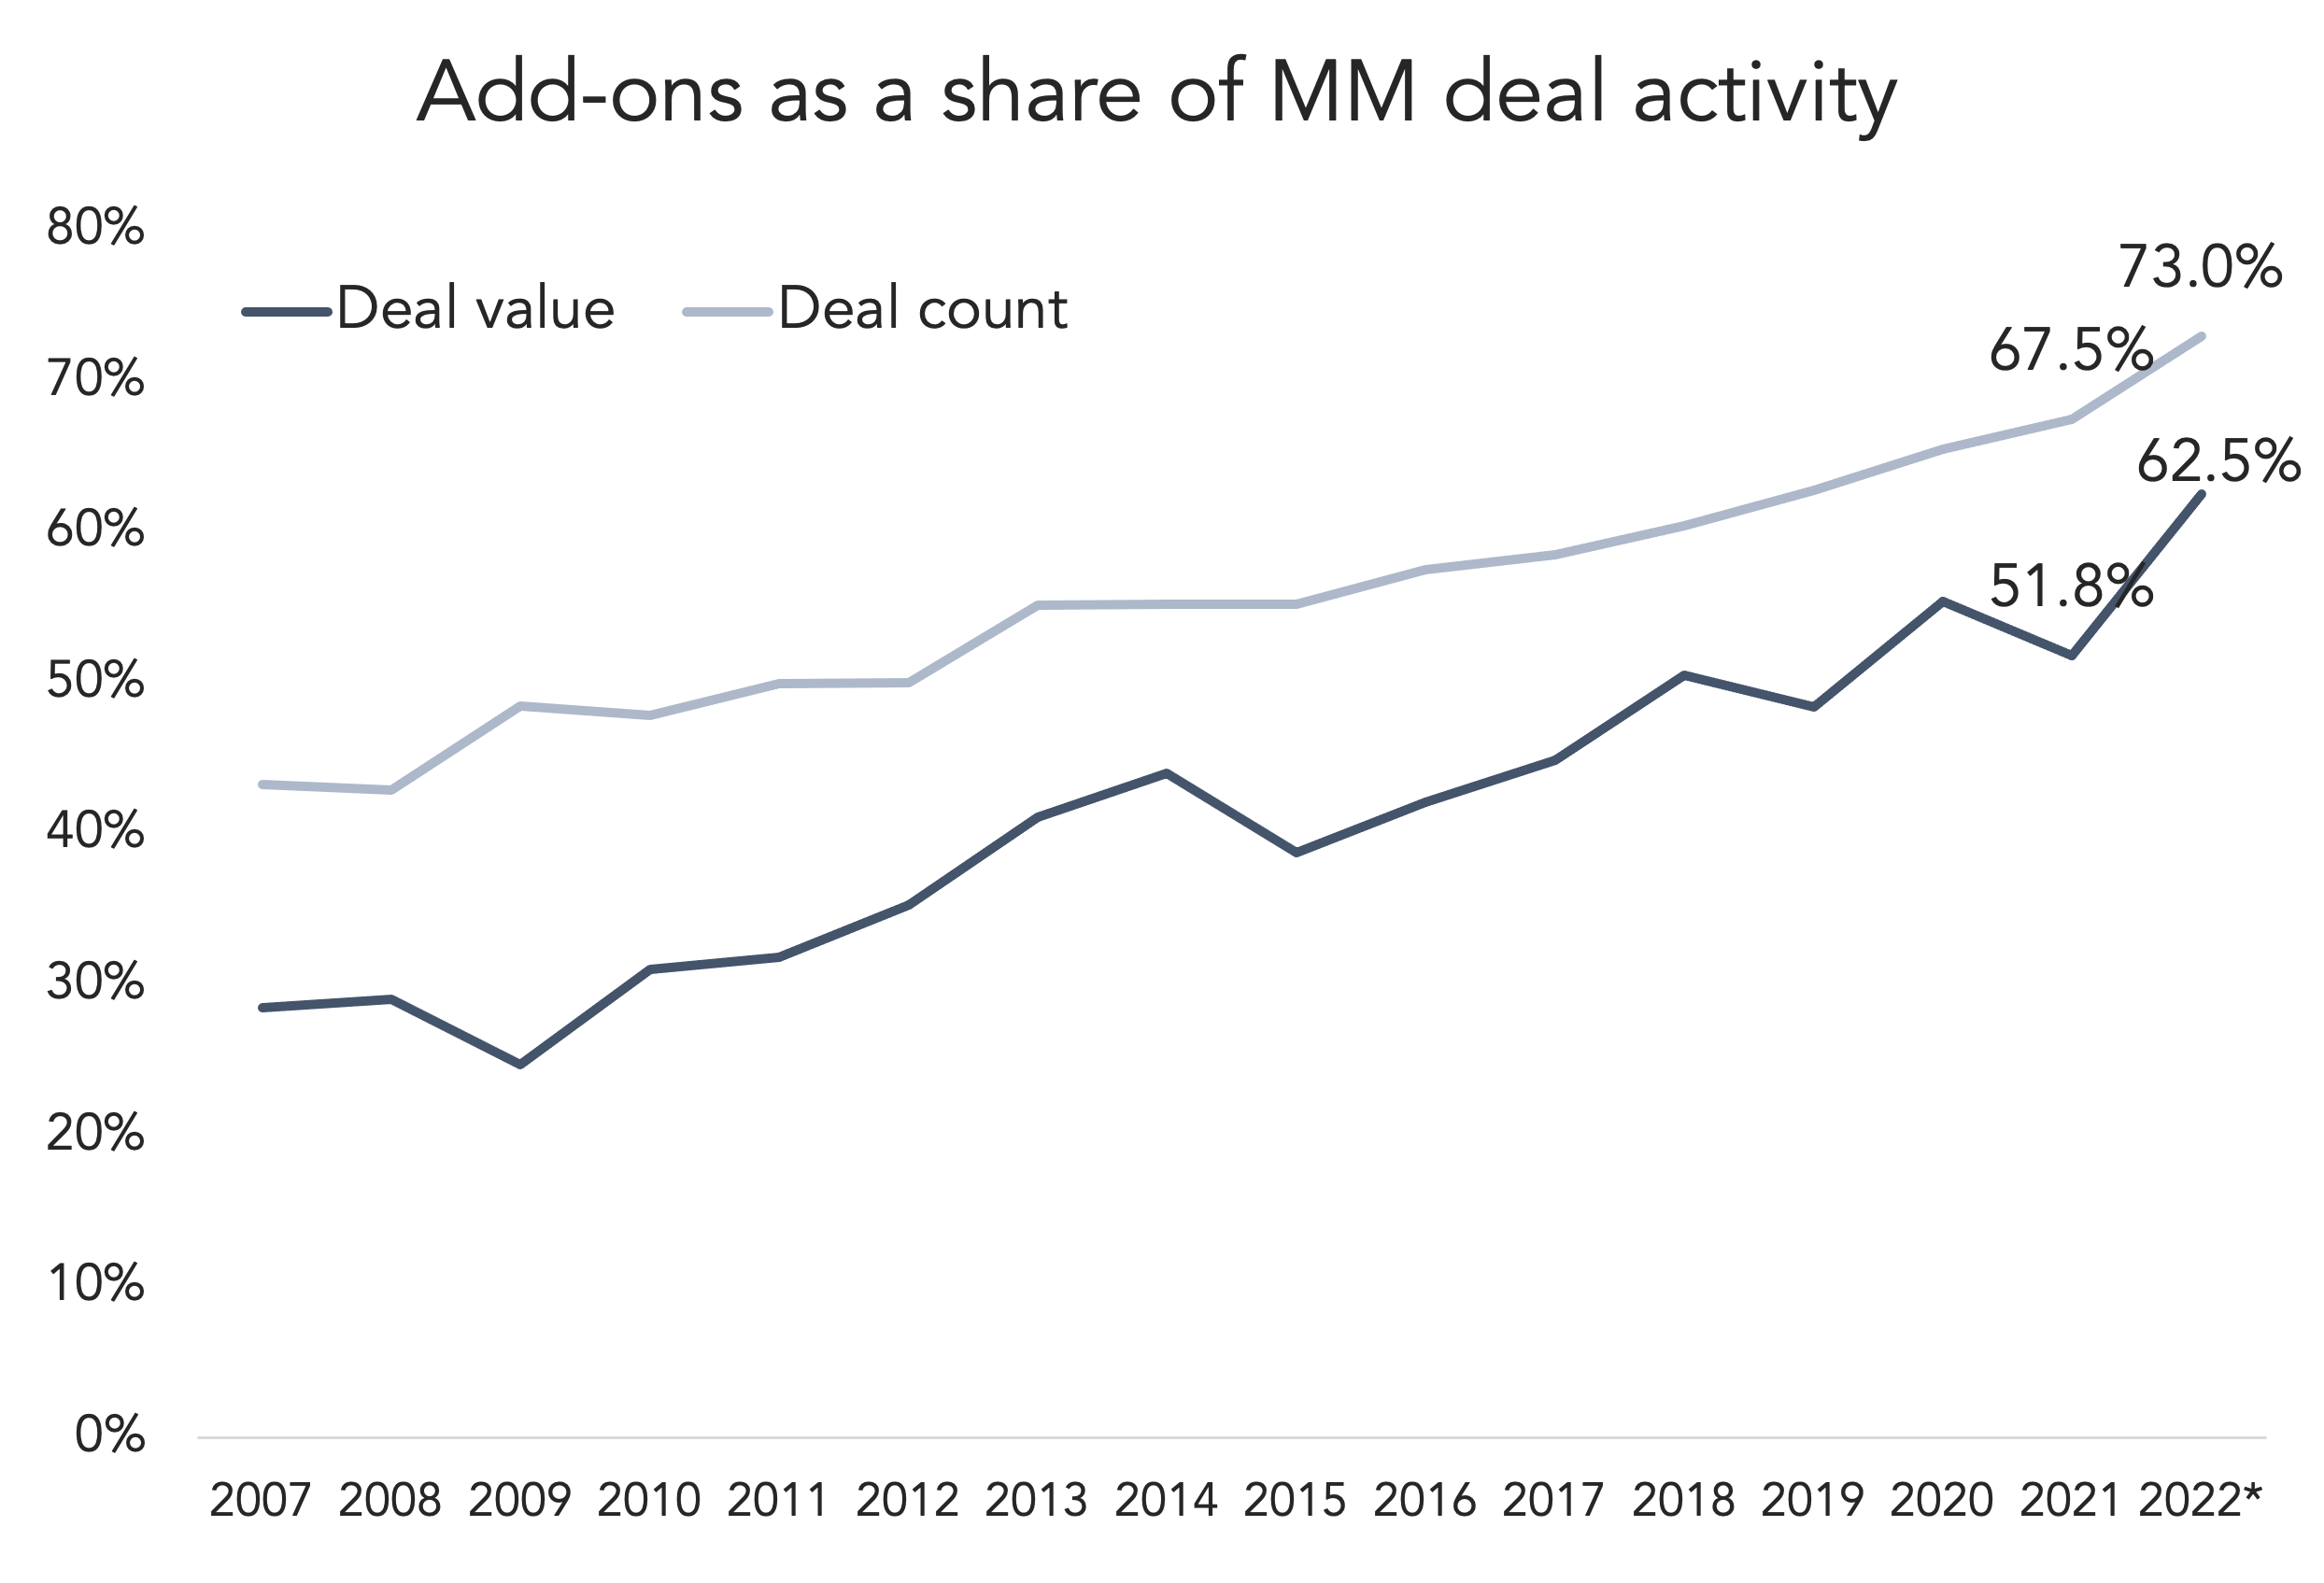
The ratio of add-ons in the middle market is increasing, according to PitchBook’s Q2 2022 US PE Middle Market Report. That’s been an evergreen trend for the past decade, but it appeared to go into overdrive in 2022. Add-ons now account for 73% of all middle market activity, up from 67.5% last year. One of the hallmarks of 2021 was a rush to buy new platforms—in the buy-and-build era, when LBOs increase, the add-ons aren’t far behind. And because investors have become so proactive with buy-and-build—sometimes identifying add-on targets before talking to the platform target—the add-on numbers would increase pretty quickly after a year like 2021.
There should be a theoretical ceiling for the chart above. Ten years ago, add-ons accounted for half of all middle market activity, and we’re now almost at 75%. Is it possible to see 80%? It could be over the next couple of years. Investors will be executing on their growth plans for their new platform companies, while the market for new LBOs appears to be chilling. An 80% reading wouldn’t be very actionable for investors, but it would be a remarkable reflection of the buy-and-build model over the past decade.
(Past performance is no guarantee of future results.)



Latest news

Top 50 BDCs Accounted for 75% of Nonaccrual Loan Cost in Q2’26
The 50 largest BDCs, on the basis of total debt investments as of the second quarter of 2026, accounted for 75% of the total aggregate reported value of nonaccrual debt at cost and fair value.

US private debt AUM ($B) by channel
In 2025 and the early part of 2026, the retail channel added AUM to the asset class at a much faster rate than institutional investors in both regions, with growth rates of 43.7% globally, 41.4% in the US, and 73. 1% in Europe through the beginning of 2026 compared with year-end 2024 figures.
