



Download PitchBook’s Report here.
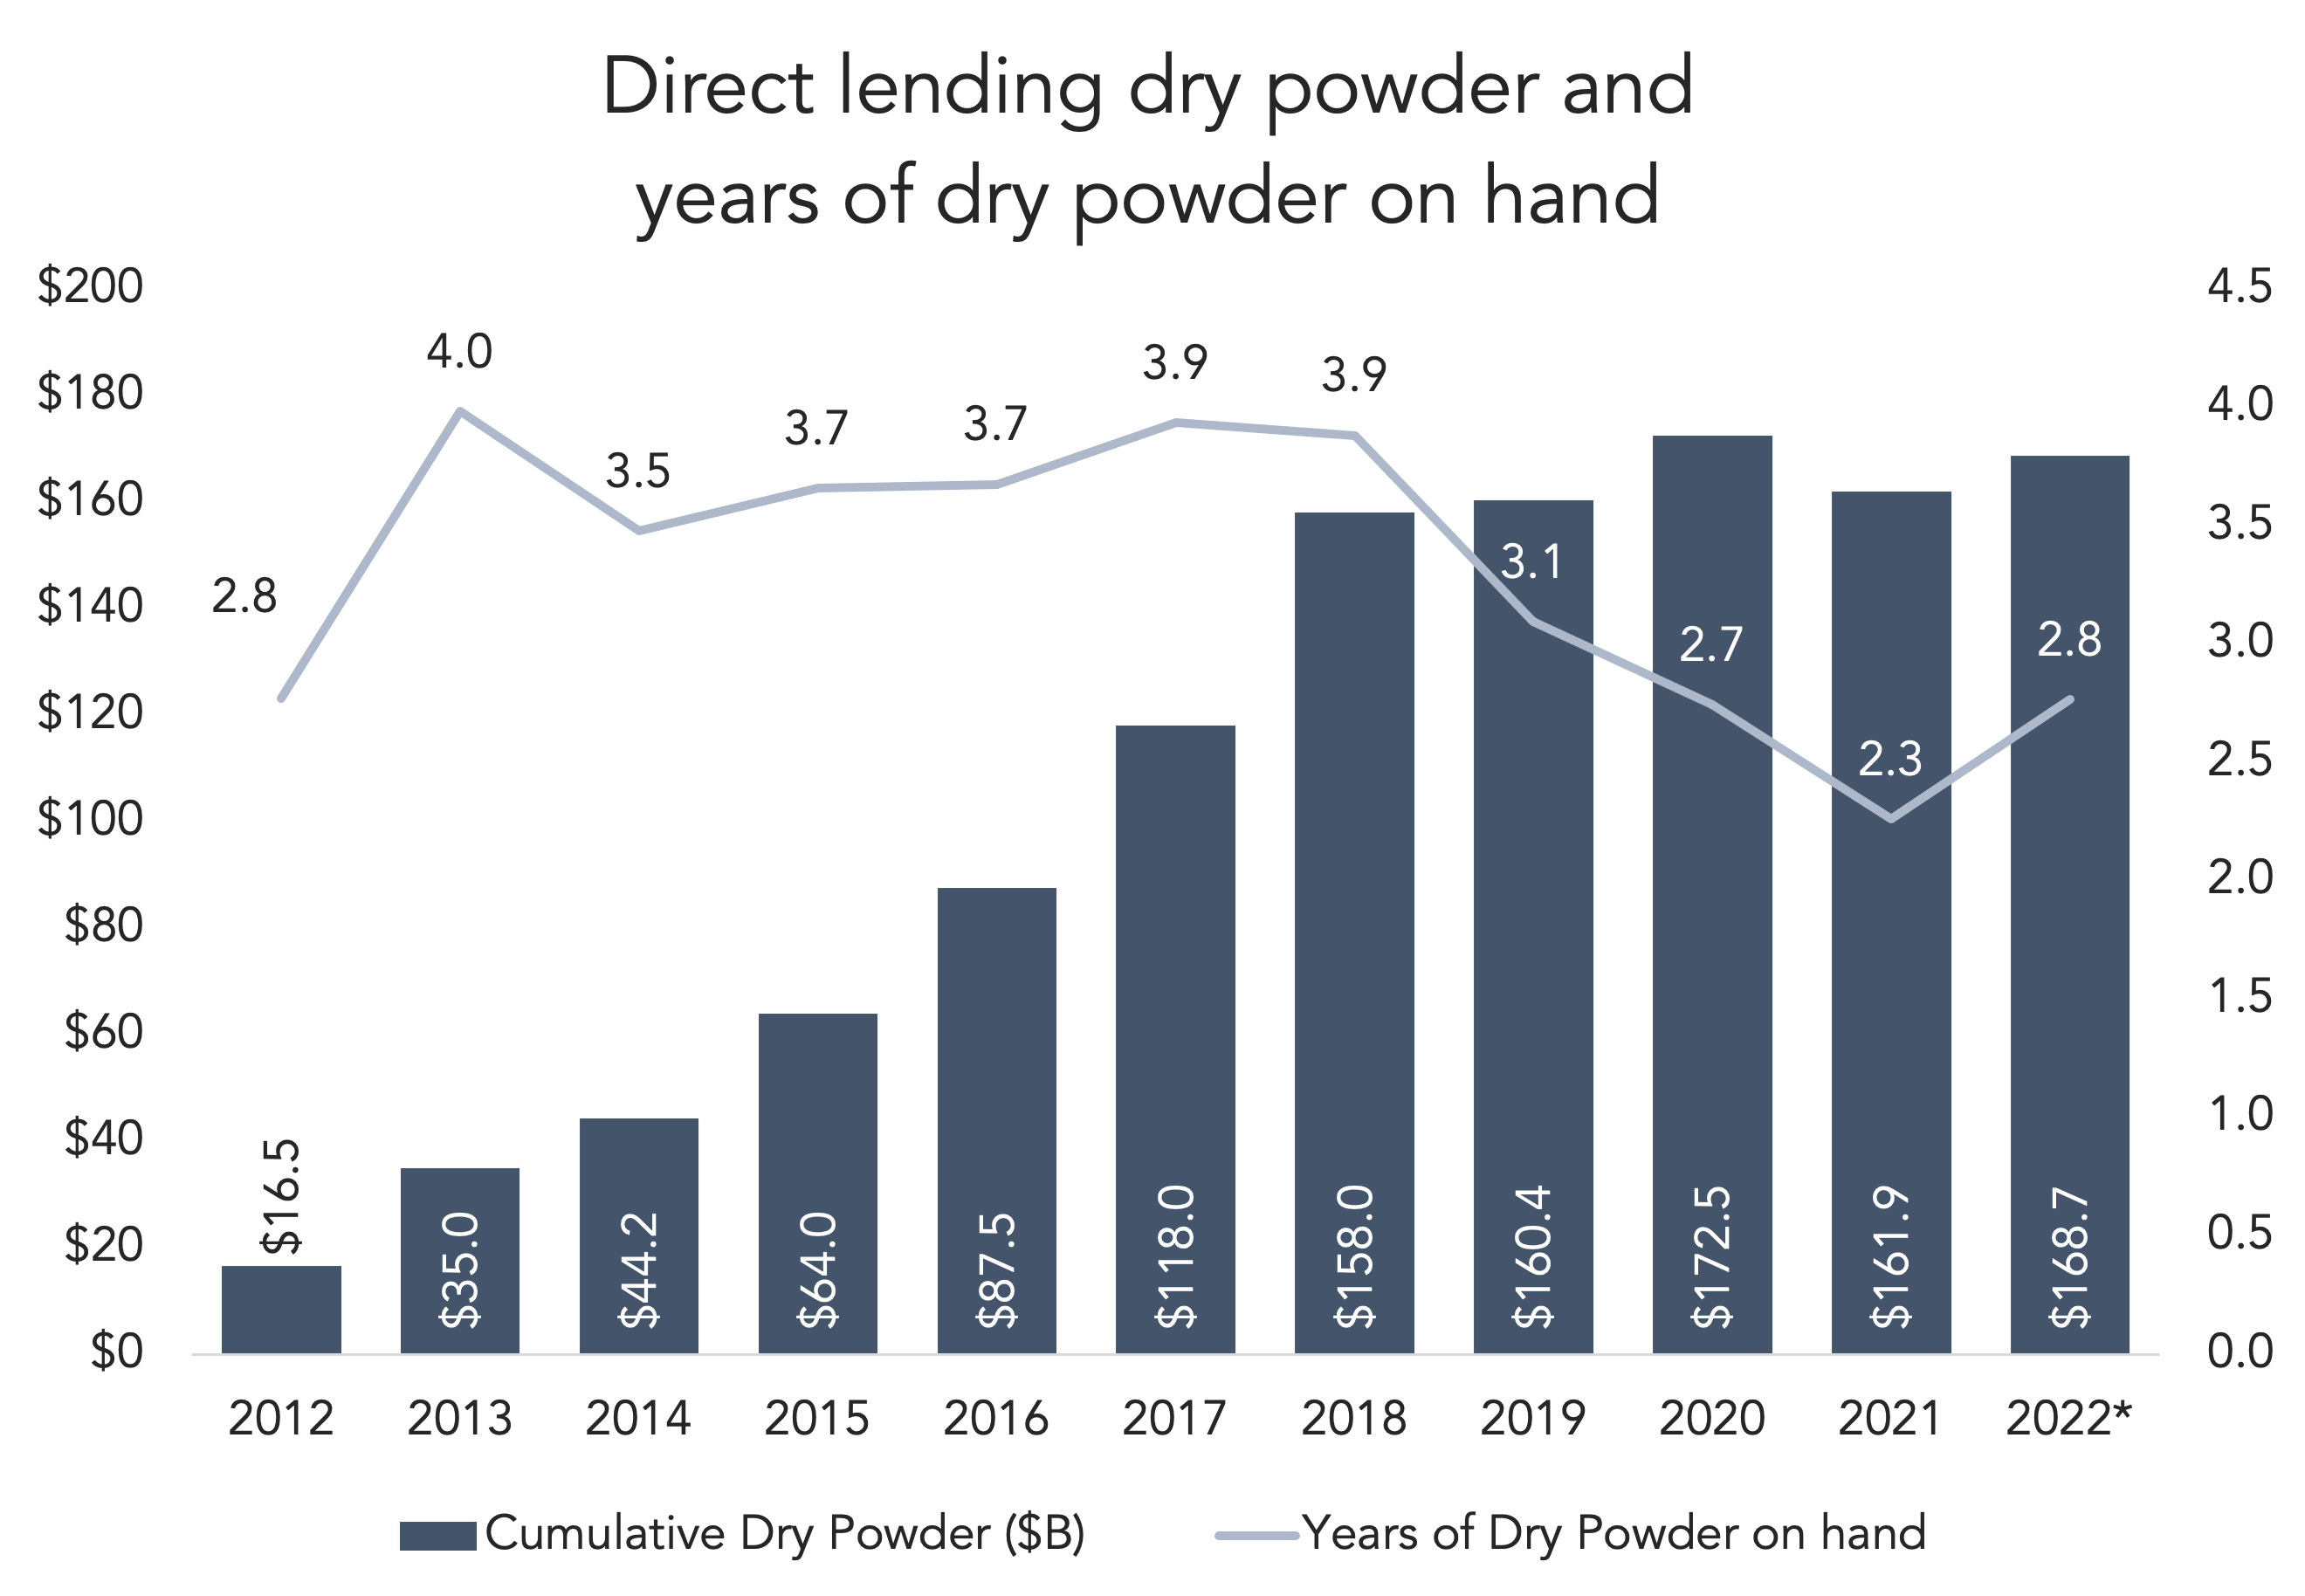
PitchBook’s latest Private Debt Report is now available. Direct lending is “the standout strategy” among private lenders, now accounting for more than a third of all capital raised in the private debt market. The ratio was actually higher last year, 46.5%. Direct lending is joined at the hip with PE dealmaking, which hit $2 trillion in activity between the US and Europe last year. That deal frenzy offered a steady supply of lending opportunities. Capital deployment was crisp; despite raising a record $103.6 billion last year, dry powder in the direct lending strategy actually declined by 6%. For lenders, the deal bonanza caused the “years of dry powder on hand” metric to decline to its lowest level in a decade, though that figure reflected an unsustainable pace and has bounced back this year. Cumulative dry powder levels, after climbing like a staircase since 2012, have barely budged over the last five years. Between 2012-2018, direct lending dry powder increased by almost tenfold. Between 2018-H1 2022, it increased by about 6.8%.
Taron Wade, LCD Director, notes that “direct lenders stepped up to the plate” in the post-COVID secondary market, “providing some liquidity for borrowers, even for larger buyout transactions.” Along those lines, it’s worth mentioning the Citrix kerfuffle, which impacted blue chip underwriters like BofA, Goldman and Credit Suisse. Combined losses were around $600 million to $700 million. Chilly news for the rest of Wall Street, which was already hesitant about buyout lending, and yet another opportunity for direct lenders to gain ground in the LBO market.
(Past performance is no guarantee of future results.)



Latest news


Summer recovery stalls as secondary loan pricing retreats from September peak
The summer recovery in US leveraged loan secondary market pricing has recently lost momentum, with average prices declining to 95.54…

Middle market debt held by BDCs vs High yield vs Treasury yields
The blue line represents the dividend yield of the VanEck BDC Income ETF (BIZD), which stood at 11.8% as of…