


Transact Documentation Scorecard and the State of Play for Smaller LBO Loans (Part II)

Click here to download full report
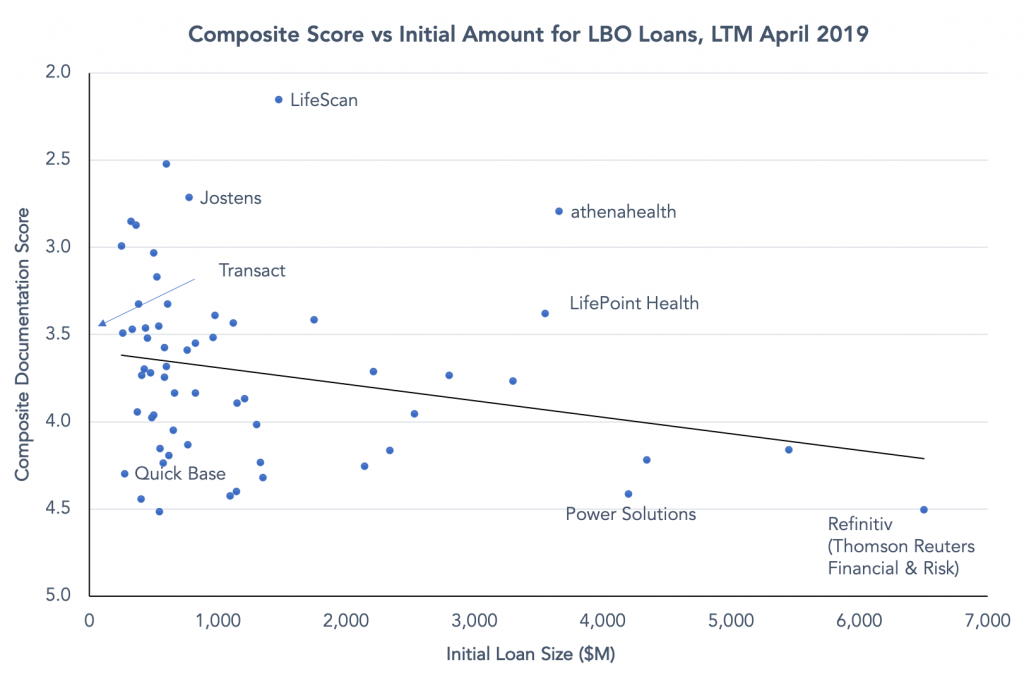
Broadening our lens, a simple scatter plot of LBO loans over the past year for which Covenant Review has analyzed final terms or updated preliminary terms illustrates the fact that higher-scoring loans tend to be concentrated at the smaller-end of the market. Size, however, is not destiny when it comes to covenant terms. There are many other factors at play, of course, including sponsorship, the strength of the overall credit story and market conditions.
Take the $260 million Quick Base loan, which benefited from the backing of big-boy sponsor Vista. The loan cleared in February with a Documentation Score similar to such aggressively structured jumbo loans as Refinitiv and Power Solutions. At the same time, the $2.6 billion loan for Athena Healthcare’s LBO by Veritas ran into lender resistance that pushed terms tighter and resulted in a far more protective Documentation Score on Covenant Review’s scale.
What is Documentation Score?
Covenant Review’s Documentation Scores express the strength of an instrument’s covenant protections on a number scale running from 1 (strongest) to 5 (weakest) with pluses and minus to between 1 and 5 to provide more context to the scores. Documentation Scores are derived from Covenant Review’s market-leading analysis of loan documents by our staff of experienced leveraged finance attorneys. For each loan, Covenant Review will provide one overarching Composite Score that is based on the following three sub-scores: (1) Collateral Protection, (2) Default Protection and (3) Lender’s Repricing Optionality. Covenant Review applies a proprietary weighing method to a series of qualitative, empirical, and judgment factors to produce each composite score and sub score.
Contact: Steven Miller



Latest news

Top 50 BDCs Accounted for 75% of Nonaccrual Loan Cost in Q2’26
The 50 largest BDCs, on the basis of total debt investments as of the second quarter of 2026, accounted for 75% of the total aggregate reported value of nonaccrual debt at cost and fair value.

US private debt AUM ($B) by channel
In 2025 and the early part of 2026, the retail channel added AUM to the asset class at a much faster rate than institutional investors in both regions, with growth rates of 43.7% globally, 41.4% in the US, and 73. 1% in Europe through the beginning of 2026 compared with year-end 2024 figures.
