


US Asset-Based Lending Market Size

Charts
Download Report
Click here to download CFA’s The 2019 Secured Finance Market Sizing & Impact Study
US ABL Market
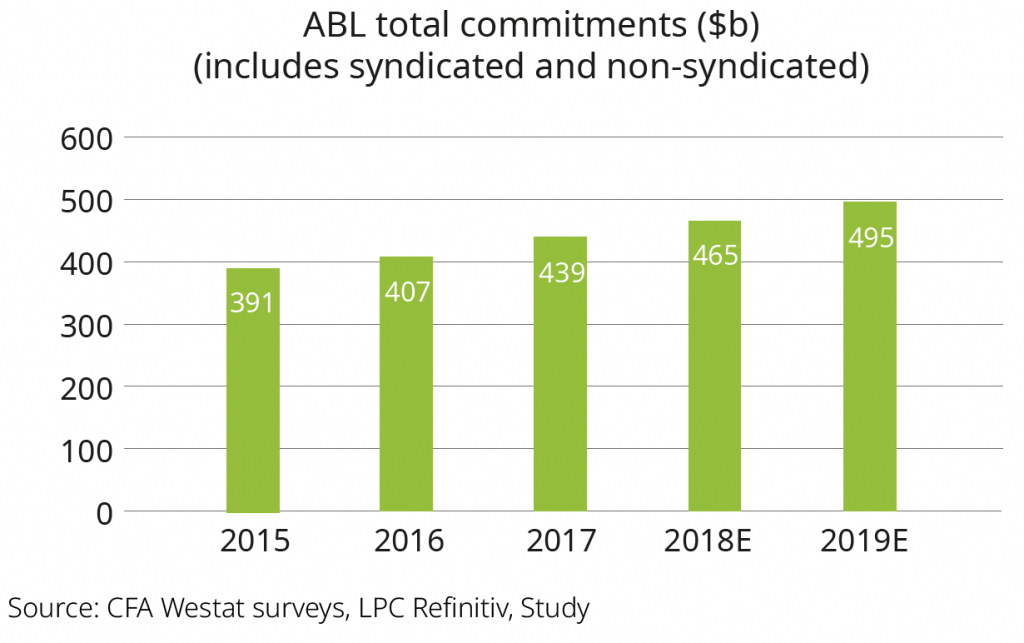
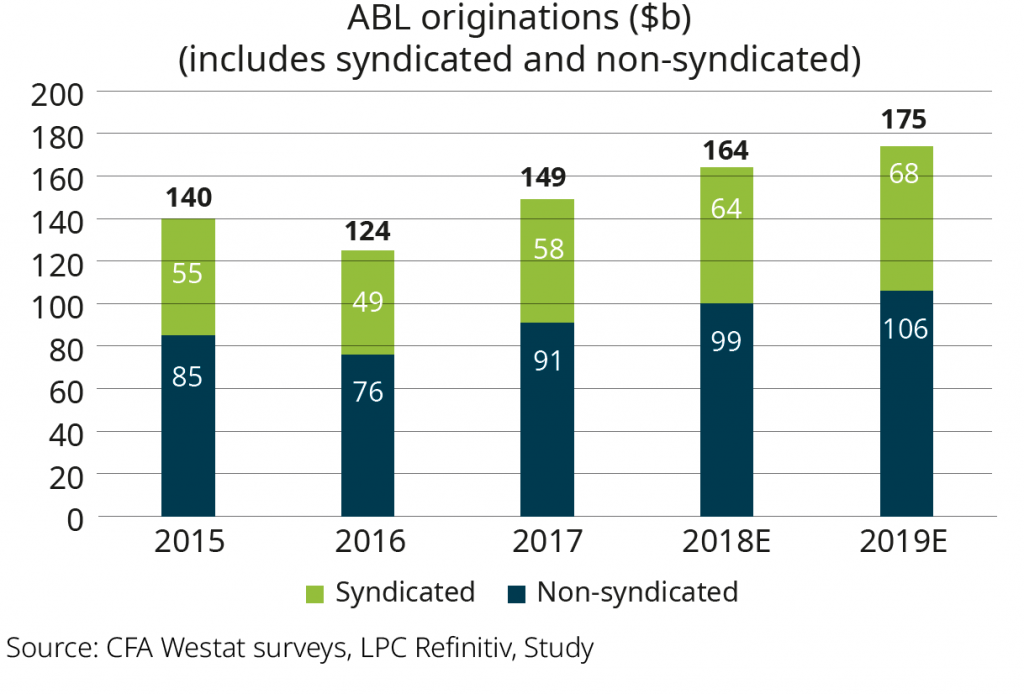
Total ABL commitments by US lenders were about $465 billion in 2018 and are expected to grow in the range of 6%–7% in 2019, as new ABL commitments continue to outpace run-off. About $164 billion of ABL commitments were originated in 2018, a slight increase over 2017.
Syndicated to non-syndicated
LPC Refinitiv maintains track of syndicated ABL loans outstanding in the market. As of the end of Q3 2018, there were $278.1 billion of syndicated ABL loan commitments in the market. Based on this value and further analysis, The 2019 Secured Finance Market Sizing & Impact Study sized the syndicated market at $283.7 billion as of the end of 2018.
We use this value to net from the aggregate amount of $465 billion to arrive at an estimated $182 billion of non-syndicated ABL in the market – or about 39% of the total market. We have assumed that this ratio of syndicated to non-syndicated holds steady for all periods shown
Contact: Aydan Savaser



Latest news

Information Technology Topped Nonaccruals on a Cost Basis
The information technology sector moved from second place in the first quarter to the top of the list in the second quarter
Information Technology Topped Nonaccruals on a Cost Basis
The 50 largest BDCs, on the basis of total debt investments as of the second quarter of 2026, accounted for 75% of the total aggregate reported value of nonaccrual debt at cost and fair value.
