Chart of the Week: Downside Protection
At the depth of the credit crisis, middle market loan prices proved less volatile than their broadly syndicated counterparts.
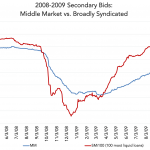
At the depth of the credit crisis, middle market loan prices proved less volatile than their broadly syndicated counterparts.
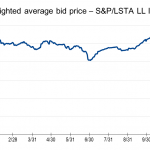
Secondary loan bid levels have softened concurrent with overall public market volatility.
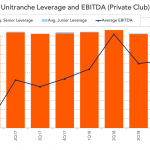
Leverage for club middle market unitranche deals has stayed a constant 5x.
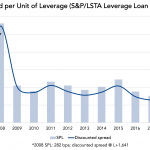
Since 2015 investors in the Leveraged Loan Index are being compensated less-well for risk.
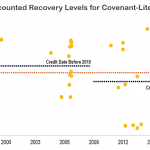
While data for cov-lite bankruptcies are limited, post-crisis recoveries were below pre-crisis levels.
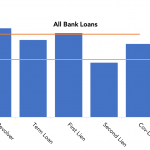
Data suggests that loan recoveries are both facility and structure dependant.
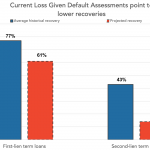
Higher leverage and weaker structures for leveraged loans is expected to result in worse than historic recoveries.
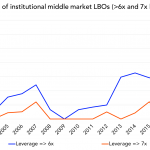
The share of highly leveraged midcap deals sold to institutional investors is at levels well beyond those seen during the frothy 2006-07 period.
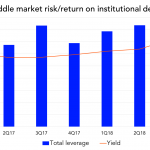
Debt to ebitda has risen steadily for institutional middle market term loans, but yields are up as well.
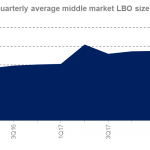
Over the past three years, the average middle market LBO has generally remained range-bound, between $150-200 million.