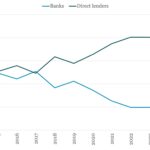
Chart of the Week: Leverage Takeover
Middle market buyout financings increasingly dominated by direct lenders. Source: LSEG LPC. Middle Market LBO volume.
Middle market buyout financings increasingly dominated by direct lenders. Source: LSEG LPC. Middle Market LBO volume.
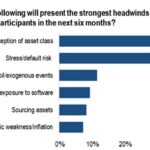
Investors bombarded with scary headlines worrying less about real private credit risks. Source: PitchBook

IT deals commanded a larger piece of the M&A pie in 2025. Source: PitchBook
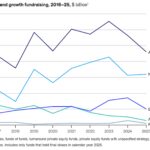
The US was a relative bright spot in global private equity fundraising in 2025. Source: Preqin, McKinsey analysis
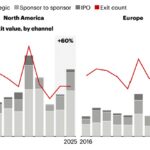
US and European exits were on the rise in 2025. Source: Dealogic, Bain & Company
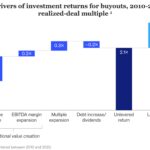
Private equity returns are largely attributable to revenue growth. Source: McKinsey & Co, SPI by StepStone
The middle market punches above its weight. Source: State Street Private Equity Index as of 9/30/2025
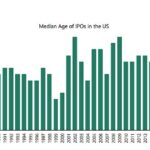
US companies that go public are opting to stay private longer. Source: Jay Ritter, University of Florida; Apollo’s The Daily Spark
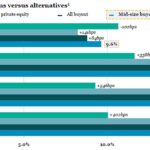
In the long-term private equity pays for more risk with better returns. Source: MSCI
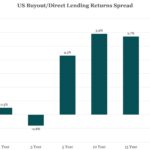
Private equity remains an attractive option for investors through cycles. Source: PitchBook