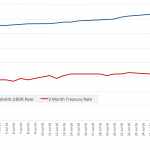
Chart of the Week: Rate Race
With the Fed more likely to push rates in September, Libor rose more quickly last month than comparable Treasuries. Sources: U.S. Department of the Treasury/FRED
With the Fed more likely to push rates in September, Libor rose more quickly last month than comparable Treasuries. Sources: U.S. Department of the Treasury/FRED
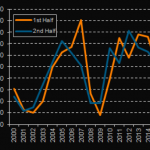
Middle market sponsored volume for the first six months of 2016 was the lightest in seven years. Source: Thomson Reuters LPC
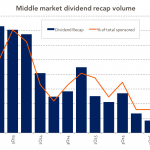
Thanks to continued concern about market volatility, dividend recap activity in the middle market has slowed to a crawl in the second quarter. Source: Thomson Reuters LPC
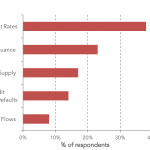
Attendees at last week’s Fitch/LPC Loan and CLO Conference said Fed’s rate inaction was most surprising market news so far this year. Source: Fitch Ratings and Thomson Reuters LPC Loan and CLO Conference
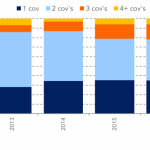
Almost two-thirds of middle market leveraged loans have two or more maintenance covenants; only 2.5% of middle market loans are cov-lite. US middle market covenant counts Source: Thomson Reuters LPC; SEC Filings
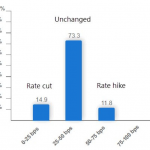
Thanks to Brexit, market watchers now think the probability of a Fed rate cut this year outweighs that of a rate hike. Sources: The Daily Shot, CME Group
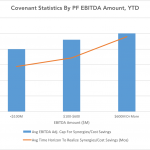
The larger the borrower size, the more time lenders allow companies to realize synergies, and the greater the Ebitda adjustments. Source: Covenant Review
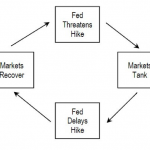
US interest rate policy is captured in a feedback loop as Fed lets exogenous worries undermine future action. Source: BofA Merrill Lynch Global Research, The Daily Shot
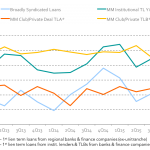
Buy-and-hold middle market loans (“MM Club/Private TLB”) don’t typically trade among holders, so are less subject to abrupt price swings. Sources: Thomson Reuters LPC; represents all-in yield (3 years)
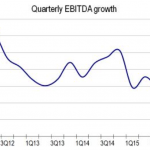
Leveraged loan issuers have maintained solid cash flow growth for the past four years, as the economy continues to muddle along. Source: LCD, an offering of S&P Global Market Intelligence