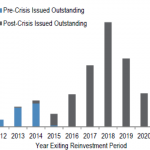
Chart of the Week – Running Off
Almost two-thirds of all US CLO vehicles exit their reinvestment periods during 2017-19, leaving demand gap. US CLOs outstanding by reinvestment period ($Bns) Source: JP Morgan, US Fixed Income Markets Weekly
Almost two-thirds of all US CLO vehicles exit their reinvestment periods during 2017-19, leaving demand gap. US CLOs outstanding by reinvestment period ($Bns) Source: JP Morgan, US Fixed Income Markets Weekly
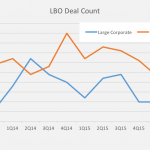
Middle market and large cap LBOs totaled thirteen so far this quarter; there were sixty for 2Q 2015. Source: Thomson Reuters LPC
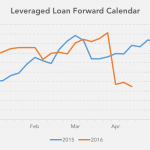
With one month of the second quarter behind us, the forward calendar for all syndicated loans remains below last year’s levels. Source: Thomson Reuters LPC; represents all loans
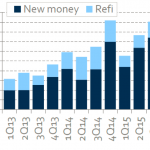
First quarter activity in the non-syndicated middle market slowed, but less sharply than for syndicated deals. Club/Private Middle Market Issuance Source: Thomson Reuters LPC
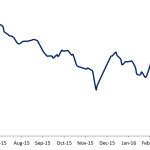
Secondary loan prices have edged up since year-end, on increased investor confidence and lack of new supply. Leveraged Loan Bid Levels Source: S&P Capital IQ; data for selected flow names
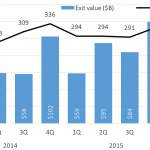
With purchase price multiples high, sponsors have sold or taken public more than 2500 portfolio companies since 2014. Quarterly US PE Exit Activity Source: PitchBook
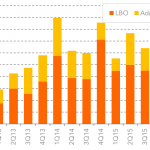
Pure middle market LBO activity slumped during the 1Q 2016, while add-ons were a greater share of M&A loan volume. Quarterly Middle Market LBO and Add-on Loan Volume Source: Thomson Reuters LPC 2Q MM Investor Outlook Survey
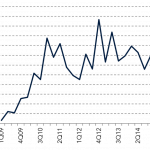
Middle market loan activity with sponsors during the first quarter has slowed to a six-year low. Quarterly Sponsored Middle Market Loan Volume Source: Thomson Reuters LPC 2Q MM Investor Outlook Survey
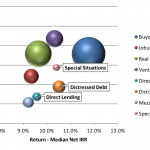
Distressed debt and special situations funds show somewhat higher returns than direct lending funds, but carry significantly higher credit risk. Risk/Return by Strategy (Vintage 2003-2013 Funds) Source: Preqin Private Debt Online; sphere size represents market capitalization
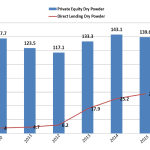
European debt funds have $28.8 billion in dry powder dedicated to direct lending; private equity has almost five times that to put to work. Source: Preqin; European Dry Powder – Private Equity & Direct Lending (USD bn)