Covenant Trends – 5/15/2023
Percentage of New Issue First Lien Loans that Cleared with a J. Crew Trapdoor (Past performance is no guarantee of future results.) Contact: Steven Miller
Percentage of New Issue First Lien Loans that Cleared with a J. Crew Trapdoor (Past performance is no guarantee of future results.) Contact: Steven Miller
Percentage of Loans with an MFN Sunset (Past performance is no guarantee of future results.) Contact: Steven Miller
Distribution of Synergies & Cost Savings EBITDA Addback Time Horizons (for Actions Resulting in Addbacks) (Past performance is no guarantee of future results.) Contact: Steven Miller
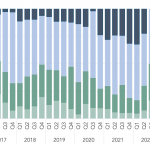
Percentage of First-Lien Loans Clearing with Key Covenant Terms by Quarter (Past performance is no guarantee of future results.) Contact: Steven Miller
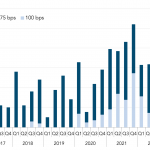
Percentage of Deals with 75+ bps MFN (Past performance is no guarantee of future results.) Contact: Steven Miller
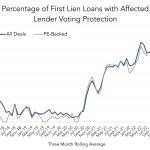
Percentage of First Lien Loans with Affected Lender Voting Protection (Past performance is no guarantee of future results.) Contact: Steven Miller
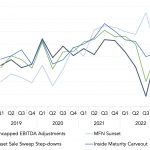
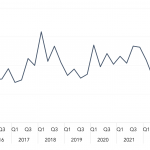
Percentage of Loans with Asset Sale Sweep Step-downs (Past performance is no guarantee of future results.) Contact: Steven Miller
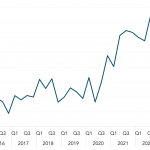
Percentage of Loans with Uncapped Synergies & Cost Savings EBITDA Addbacks (Past performance is no guarantee of future results.) Contact: Steven Miller
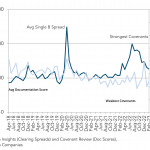
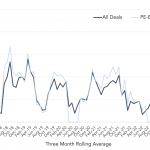
Average New-Issue Clearing Spreads (Single B) and Covenant Terms for All First-Lien Institutional Loans (Past performance is no guarantee of future results.) Contact: Steven Miller
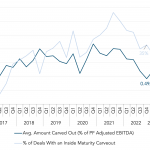
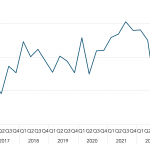
Accordion Inside Maturity (Past performance is no guarantee of future results.) Contact: Steven Miller