FitchRatings

Middle Market & Private Credit – 4/22/2024

How Does the Default Outlook for the Middle Market Compare to BSL? Download FitchRating’s Report here. The default rate for loans in Fitch’s U.S. Leveraged Loan Universe was 3.3% at the end of 2023, in line with our forecast of 3.0%-3.5% and up from just 1.6% the previous year…. Login to Read More...

Middle Market & Private Credit – 4/15/2024

How Do Covenants for Private Credit Loans Compare to Broadly Syndicated Loans? Download FitchRating’s Report here. While liability management exercises (LMEs) are not necessarily prohibited in direct lending documents, they are considerably less common than in the BSL market. We have yet to observe LMEs in the private credit portfolio rated for asset managers…. Login

Middle Market & Private Credit – 4/8/2024

What is Driving Increasing Deal Sizes in Private Credit? Direct lenders have increasingly been targeting larger companies, after previously focusing on middle market sized companies. (Fitch loosely defines larger as companies with about $500 million of debt and about $100 million of EBITDA or above)… Login to Read More...

Middle Market & Private Credit – 4/1/2024

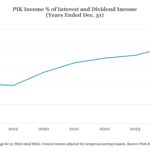
Rising Payment-in-Kind Trends in Private Credit Will Have a Mixed Impact Interests paid-in-kind (PIK) are likely to rise among private middle-market loans in the US through both amendments to existing loans and as an optionality in new loan originations, as the impact of higher rates fully kicks in and credit burden builds up among borrowers….

Middle Market & Private Credit – 3/11/2024

What Investors Want to Know: Middle Market CLO Manager Assessment Considerations Download Fitchratings’ Report here. Given the increased interest and overall expansion of the private credit sector, Fitch Ratings highlights key elements of its assessment of the capabilities of middle market (MM) CLO managers that are different (due to relevance) from that of a broadly…

Middle Market & Private Credit – 3/4/2024

Median Leverage and Coverage Fitch’s privately covered MM portfolio is comprised of generally smaller issuers (with average EBITDA of $55 million, average revenue of $296 million and average debt of $322 million). The portfolio is comprised of issuers in the b+* to c* range (asterisk denotes Credit Opinion)…. Login to Read More...

Middle Market & Private Credit – 2/26/2024

Fitch’s Private Middle Market Portfolio, Rating Activity Defaults in Fitch’s PMM portfolio persisted at a low level in 4Q23 with two issuers defaulting, bringing the year’s total to 15 defaults across 10 issuers on a portfolio of around 275 companies…. Login to Read More...

Middle Market & Private Credit – 2/19/2024

Fitch’s Private Middle Market Portfolio, Rating Activity Upgrades/downgrades in Fitch’s PMM portfolio are generally skewed toward downgrades, as issuer ratings can be constrained on the upside based on limited scale. Downgrades outpaced upgrades in 2023 as pressure from higher interest rates affected the FCF and financial flexibility of issuers in lower rating categories…. Login to

Middle Market & Private Credit – 2/12/2024

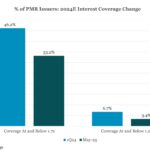
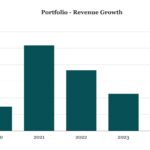
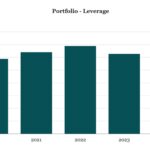
Fitch’s Privately Monitored Middle Market Portfolio Overview, 4Q23 In the charts above, Fitch presents aggregate data for MM companies, defined as in the area of $500 million of debt or $100 million of EBITDA or below, that it privately rates for asset managers. Interest coverage (EBITDA/interest) is estimated to have declined to 1.6x in 2023…

Middle Market & Private Credit – 2/5/2024

Fitch’s Privately Monitored Middle Market Portfolio Overview, 4Q23 In the charts above, Fitch presents aggregate data for MM companies, defined as in the area of $500 million of debt or $100 million of EBITDA or below, that it privately rates for asset managers. Fitch estimates median EBITDA leverage of 6.0x for 2023 and expects the…