Chart of the Week: Headed Up?
The 30-Year US Treasury index has been on a down slide for over three decades…so far.
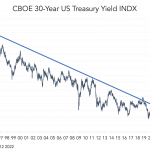
The 30-Year US Treasury index has been on a down slide for over three decades…so far.
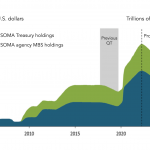
Quantitative tightening is expected to reduce the Fed’s balance sheet by $2 trillion.
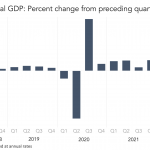
Not since 1969 have there been two milder consecutive negative growth quarters.
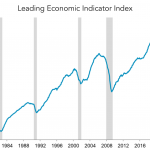
The Conference Board index of ten leading indicators points to only a modestly slowing economy.
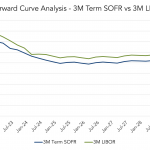
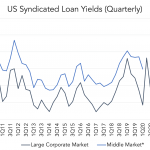
Forward expectations for loan benchmark rates are peaking in early 2023.
The illiquidity premium for middle market loans is a staple regardless of how spreads change.
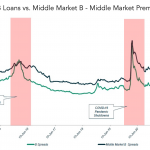
The middle market illiquidity premium persists for all but the briefest volatile periods.
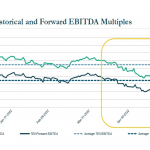
Recent concerns about rising rates and a possible recession has weighed on public equity multiples.
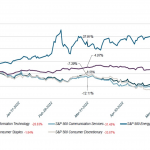
Since year-end 2021, previously performing sectors have seen selloffs in public equities.
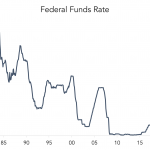
While the Fed may push rates up to 3%, that’s nowhere near historic highs.