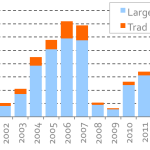
Chart of the Week – Head Start
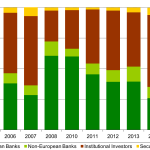
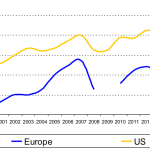
By 2002 the share of US leveraged loans by institutional investors had surpassed 60%; it took Europe twelve more years to reach the same point. Institutional Investors’ Share of the Primary Market Source: S&P Capital IQ; 2009 date not meaningful