Chart of the Week

Chart of the Week - 6/23/2014

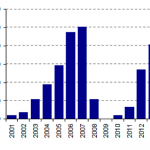
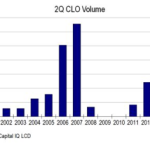
Two-Bit Performance  While two quarters does not a full year make, CLO issuance for 2Q this year will be the best second quarter in loan market history. That would beat 2007’s record of almost $33 billion, when annual volume hit just under $105 billion…. Login to Read More...

CHART OF THE WEEK

Outer Banks  US banks have surrendered share of the institutional loan market to their shadow selves for decades, but CLO’s, hedge funds, finance companies, and other institutional funds are poised to finish the job in the wake of increased regulation.   Primary Market for Highly Leveraged Loans… Login to Read More...

CHART OF THE WEEK

CLO 1.0, 2.0, 3.0…and Counting  Loan securitization managers are sprinting to print new vehicles ahead of implementation of risk retention rules which are likely to inhibit future CLO formation. Sources: Thomson Reuters… Login to Read More...

CHART OF THE WEEK

Coming Attractions Lower interest rates have this year pushed cash into junk bond mutual funds and out of loan funds, though the velocity for both is slowing. Additional Sources: S&P, Forbes… Login to Read More...

CHART OF THE WEEK

Oh, That Default The long-awaited default of Energy Future Holding’s$19.5 billion in loans, while pushing April’s figure by volume to 4.6% – a four-year high – is not expected to signal any change in analysts’ positive loan performance outlook.                … Login to Read More...

CHART OF THE WEEK

Par for the Course  Softness in market technicals has driven loan prices for new-issue leveraged loan paper below par for the first time in six months, perhaps signaling better times for investors.     … Login to Read More...

Chart of the Week

Taper Vapor The Fed’s continued reluctance to predict rate increases anytime soon, leaves Treasury yields range-bound while fixed income investors party on… Login to Read More...