Chart of the Week – Debt March
While some metrics of highly leveraged loans for new buyouts are approaching 2007 levels, by other measures, the market is at more reasonable levels…. Login to Read More...
While some metrics of highly leveraged loans for new buyouts are approaching 2007 levels, by other measures, the market is at more reasonable levels…. Login to Read More...
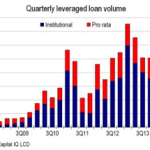
Stall Speed Issuing spreads for leveraged loans have firmed, causing a slowdown in dividend recaps and repricings for the third quarter. M&A-related volume is off 20% over last year…. Login to Read More...
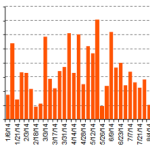
Libor Day Pent-up demand post-Labor Day drove high-yield volume to its best week since early June. Year-to-date issuance is $208.8 billion – squeaking by last year’s $206.1 billion. … Login to Read More...
Uncle Bucks Whatever the investing climate is for the balance of the year, 2014 will see the best fundraising for PE sponsors since 2008. Source: Thomson Reuters Buyouts… Login to Read More...
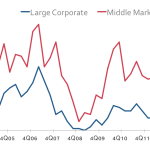
Buyout Buckets Middle market LBOs typically outnumber their large cap counterparts, but that pattern has reversed, and midcap activity remains off 2012 levels…. Login to Read More...
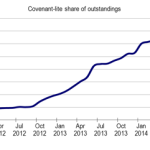
Got Covenants? Over half of all outstanding leveraged loans have no maintenance covenants, affording significant protection to those issuers in a downturn. Source: S&P Capital IQ LCD… Login to Read More...
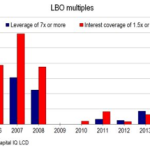
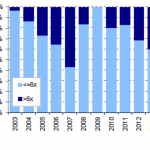
Rhymes, Not Repeats While growing over the past four years, the share of post-crisis buyouts with hyper-leverage and weak coverage metrics pales in comparison with the heady pre-crisis days…. Login to Read More...
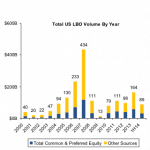
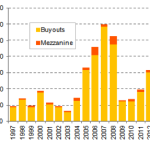
Not For Sale Leveraged buyout activity since the credit crisis has been muted, though 2014 volume could be best since 2006…. Login to Read More...
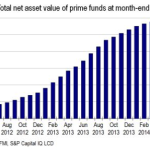
Prime Targets Retail loan funds have suffered outflows 14 of the past 16 weeks, shrinking net additions to $765 million so far this year, compared to $30 billion for the same period last year…. Login to Read More...
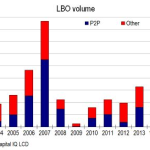
Tale of Two Vintages By one measure – public-to-private buyouts – today’s market is non-existent relative to pre-crisis levels. But sponsor-to-sponsor deals and corporate spin-outs are at a record pace…. Login to Read More...