


Private Debt Intelligence – 10/21/2019

Private Debt Performance Slows as AUM Grows
Chart
Download Data
[wpdm_package id=’29320′]
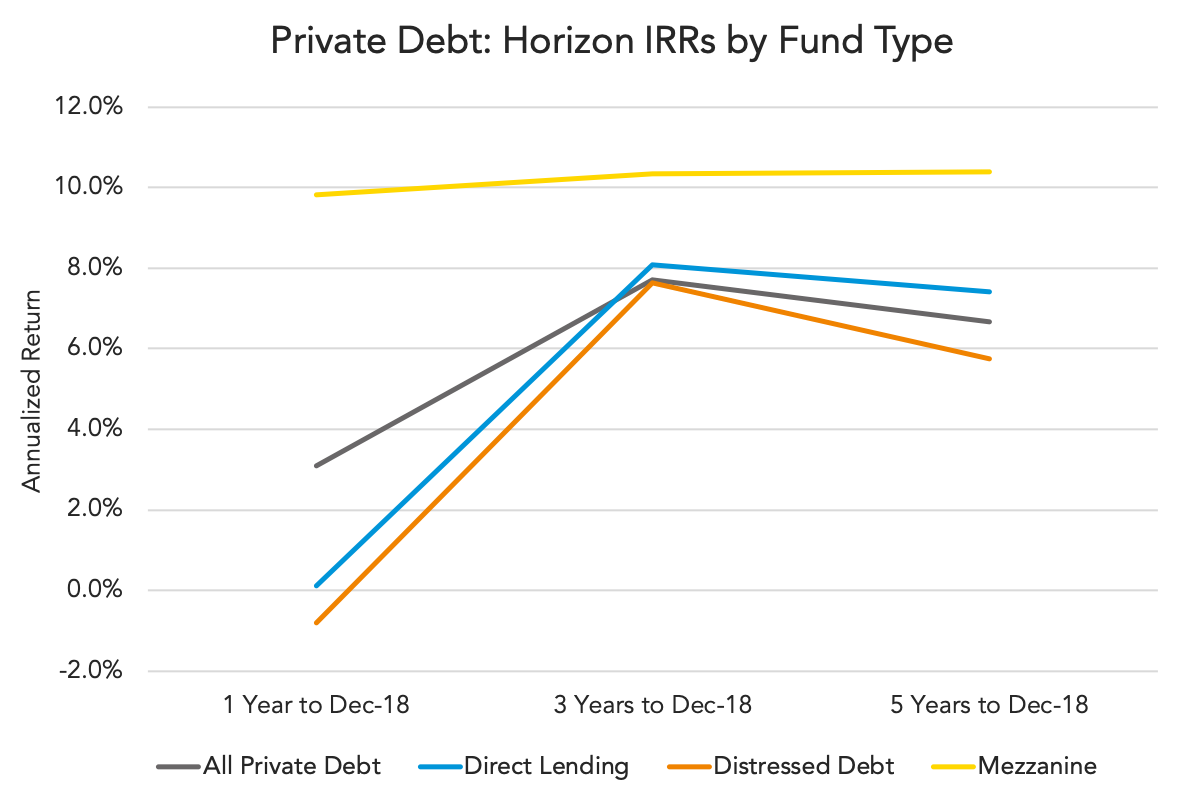
Returns for the private debt asset class as a whole have slowed over the past year, with distressed debt and direct lending funds contributing most to this slump. Over the one-, three- and five-year horizons, mezzanine funds have performed the strongest of the debt strategies, posting an annualized return of 9.8% in the year to December 2018 and an annualized return of 10.4% over five years. In contrast, distressed debt funds have produced the lowest returns over these timeframes, generating just 5.8% over five years, and direct lending funds have returned 6.7%.
For the first time since Q4 2016, the PrEQIn Private Debt Index has fallen as of Q4 2018, after private debt posted the lowest quarterly return (-0.58%) of the asset classes displayed. Despite this, private debt has continued to outperform real estate and natural resources since 2007.
As at December 2018, private debt assets under management (AUM) stand at $763.5bn. Direct lending funds account for the largest proportion (35%) at $263bn. This marks a $60bn increase on the year-end 2017 figure. At the other end of the scale, venture debt funds hold $14bn, the smallest amount of AUM. The highest volume of dry powder is held in direct lending funds ($112bn)– 38% of the whole private debt dry powder ($294.4bn). Distressed debt funds hold $75.5bn, followed by mezzanine funds, which hold $63.5bn. With no change, venture debt and special situations continue to make up the smallest portion of overall dry powder.
Private debt unrealized value represents 61% of the total AUM as of December 2018, meaning that increasing levels of capital are being put to work by fund managers. Amid ongoing economic turbulence, the asset class is proving its ability to provide a sustainable and reliable income stream to investors, and therefore protection on the downside.
Contact: Maria Zapata
maria.zapata@preqin.com



Latest news

US Leveraged Loans Return 3.36% to Investors YTD
The Bloomberg US Leveraged Loan Index (Ticker: LOAN) returned 0.96% in August and has gained an additional 0.28% through September…

PE dry powder
The capital that is being raised is flowing overwhelmingly to the largest, most established managers.

Middle market debt held by BDCs vs High yield vs Treasury yields
The blue line represents the current dividend yield of the VanEck BDC Income ETF (BIZD), which stood at 11.7% as…