



Download PitchBook’s Report here.
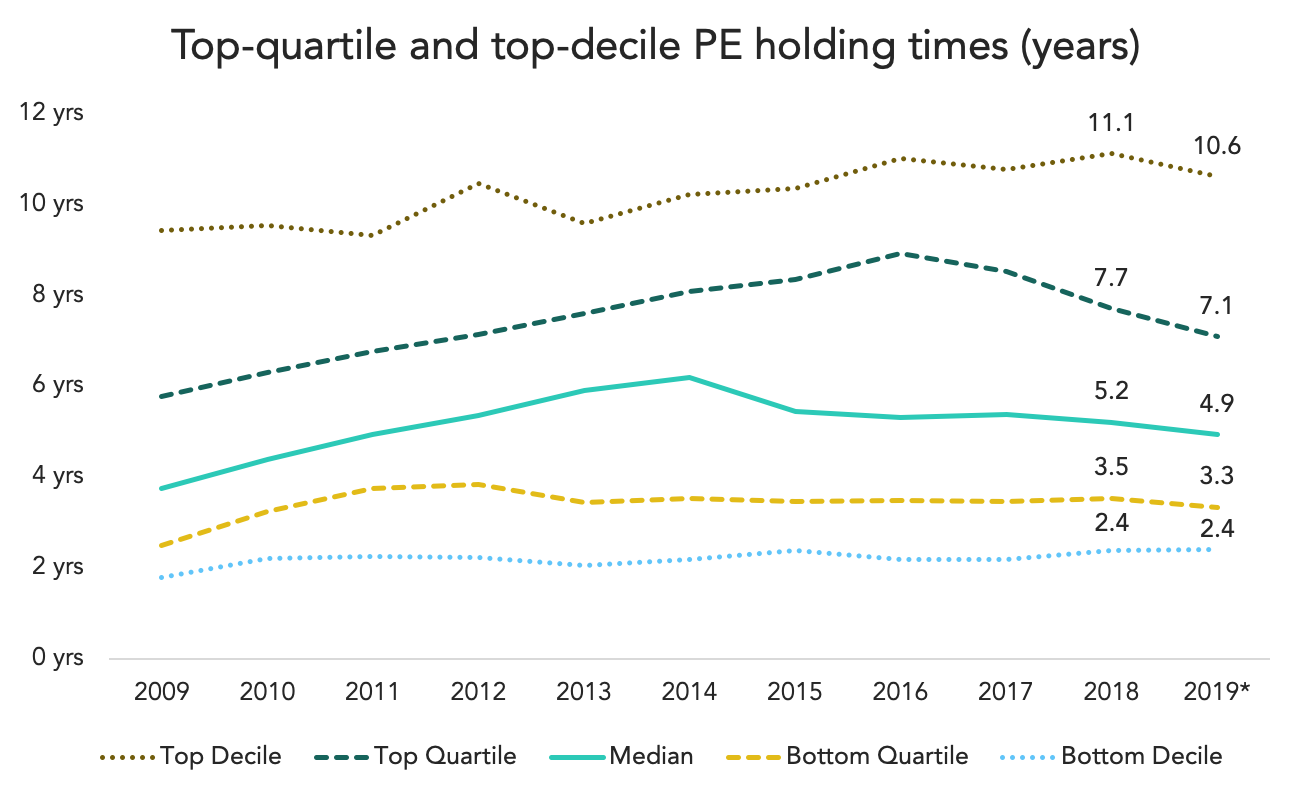
Now down to 4.9 years, the median holding time of PE assets continues to fall. That’s the first sub-5 year reading since 2011, a timeframe that saw a peak of 6.2 years back in 2014, according to PitchBook’s latest Breakdown Report. Much of the overall downfall—a good trend to see falling—is due to top-quartile hold times, which are now down to 7.1 years on a median basis. In 2016 top-quartile hold times peaked at almost nine years. That’s a fairly quick collapse in just a few years, probably a healthy one.
Knowing when to sell isn’t always straightforward. Portfolio companies aren’t “positions” that can be pared down or modified if market conditions change. Companies are big and clunky and buy-side love is in the eye of the beholder. But exits have been a bit easier to achieve in the past few years amidst a broader M&A boom. That’s made it easier to offload companies a bit sooner than they have in the past. There’s also a motivation to spend more time on the fundraising trail, which, perhaps coincidentally, has been on fire since 2016.
Less coincidental is a rise in exit committees across the industry. Formalized investment committees date back to PE’s earliest days, and each portfolio company tends to have a cheerleader who spearheads the firm’s investment. For a long time, investment decisions have passed through a more rigorous approval process while exit decisions are made by one or two senior directors who were “responsible” for that investment. Emotions get involved at the exit stage, and an increasing number of firms are formalizing those decisions and taking away individual decisionmaking. That trend is probably contributing to shorter holding times, which probably makes many LPs happy twice over.



Latest news

Top 50 BDCs Accounted for 75% of Nonaccrual Loan Cost in Q2’26
The 50 largest BDCs, on the basis of total debt investments as of the second quarter of 2026, accounted for 75% of the total aggregate reported value of nonaccrual debt at cost and fair value.

US private debt AUM ($B) by channel
In 2025 and the early part of 2026, the retail channel added AUM to the asset class at a much faster rate than institutional investors in both regions, with growth rates of 43.7% globally, 41.4% in the US, and 73. 1% in Europe through the beginning of 2026 compared with year-end 2024 figures.
