Chart of the Week: The Price is Lite
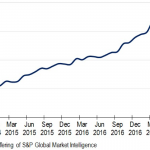
Bid levels for all covenant-lite loans have risen to 98, the highest in over two years.
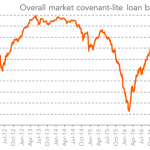
Bid levels for all covenant-lite loans have risen to 98, the highest in over two years.
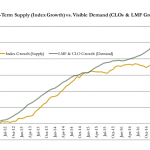
The growth of all leveraged loans has failed to keep up with the combined buying capacity from loan mutual funds and CLOs.
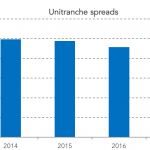
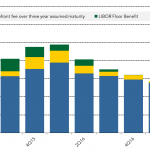
After slow declines in the past three years, unitranche spreads have dropped dramatically, thanks to competitive first lien/second lien structures.
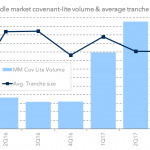
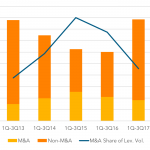
The volume of middle market cov-lite loans fell off last quarter from 2Q’s $6.3 billion; tranche size held steady at $210 million.
The percent of all leveraged loans that have only an incurrence test has grown to a record high of 73%.
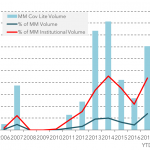
While middle market cov-lite loans only had a brief run pre-crisis, they’ve been a market feature since 2011.
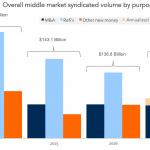
Annualized for the full year, 2017 seems poised for the most middle market leveraged loan volume since 2014.
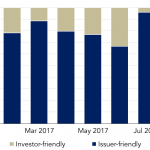
Pricing on almost 100% of US leveraged loans was flexed in favor of the issuer during July and August.
Since the correction of August 2015, all-in institutional spreads for single-B loans have contracted 200 bps.
Total leveraged loan volume so far for the first three quarters of 2017 has matched the high for the same period four years ago.