Chart of the Week – Club Room
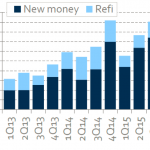
First quarter activity in the non-syndicated middle market slowed, but less sharply than for syndicated deals. Club/Private Middle Market Issuance Source: Thomson Reuters LPC
First quarter activity in the non-syndicated middle market slowed, but less sharply than for syndicated deals. Club/Private Middle Market Issuance Source: Thomson Reuters LPC
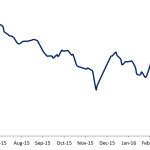
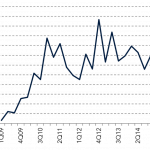
Secondary loan prices have edged up since year-end, on increased investor confidence and lack of new supply. Leveraged Loan Bid Levels Source: S&P Capital IQ; data for selected flow names
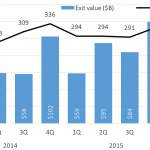
With purchase price multiples high, sponsors have sold or taken public more than 2500 portfolio companies since 2014. Quarterly US PE Exit Activity Source: PitchBook
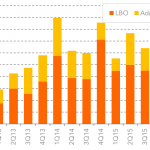
Pure middle market LBO activity slumped during the 1Q 2016, while add-ons were a greater share of M&A loan volume. Quarterly Middle Market LBO and Add-on Loan Volume Source: Thomson Reuters LPC 2Q MM Investor Outlook Survey
Middle market loan activity with sponsors during the first quarter has slowed to a six-year low. Quarterly Sponsored Middle Market Loan Volume Source: Thomson Reuters LPC 2Q MM Investor Outlook Survey
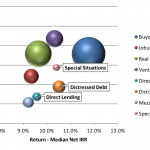
Distressed debt and special situations funds show somewhat higher returns than direct lending funds, but carry significantly higher credit risk. Risk/Return by Strategy (Vintage 2003-2013 Funds) Source: Preqin Private Debt Online; sphere size represents market capitalization
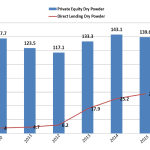
European debt funds have $28.8 billion in dry powder dedicated to direct lending; private equity has almost five times that to put to work. Source: Preqin; European Dry Powder – Private Equity & Direct Lending (USD bn)
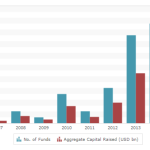
Fundraising for sixteen direct lending funds last year totaled just shy of $19 billion, nearly doubling the average 2014 fund size to $1.34 billion. Europe Focused Direct Lending Fundraising by Year Source: Preqin
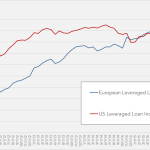
Last summer’s market volatility in the US caused loan prices to plummet, attracting attention from European loan buyers. Source: S&P Capital IQ
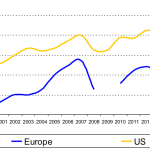
By 2002 the share of US leveraged loans by institutional investors had surpassed 60%; it took Europe twelve more years to reach the same point. Institutional Investors’ Share of the Primary Market Source: S&P Capital IQ; 2009 date not meaningful