No one loves physicals. The battery of tests, poking and prodding, with routine check-ups are low on our bucket list. We therefore approached last month’s visit to the cardiologist with trepidation. Things got interesting when he spotted on the MRI what appeared to be a widening of the aorta: “Aneurysm.”
A hasty Google search uncovered scary stories of ruptured arteries and sudden death. But we had grown to respect our doctor’s measured, thorough routine over the years. “Sometimes CT scans give us a better view,” he said. “Let’s see what that shows.” Turns out the scan recorded a narrower diameter, below the worrisome range. “We’ll just keep an eye on it.”
Our medical moment recalled the importance of how experienced private credit managers keep watchful eyes on portfolio companies. Their practices aren’t flashy but rely on methodical monitoring and reporting beginning with some version of credit surveillance reports (CSRs)...
“Powell can say whatever he wants, but ultimately the inflation numbers will dictate what happens.” – Neil Dutta, head of economic research, Renaissance Macro Research.
Featuring Charts

Chart of the Week: Returns Department
Global private fund returns of capital has begun to improve since early 2023. Source: MSCI – Private Assets in Focus(Past performance is no guarantee of future results.)
Read More
Chart of the Week: Common Ground
Higher for longer has compressed leverage for both cov-lite and cov-heavy loans. Source: LSEG LPC(Past performance is no guarantee of future results.)
Read More
Chart of the Week: Rate Expectations
Loan participants see higher defaults from 1.6% today, but not much higher. Source: PitchBook/LCD(Past performance is no guarantee of future results.)
Read More
Chart of the Week: No Ifs, Ands, or Cuts
Market observers now think a rate cut at the Fed’s June meeting is unlikely. Source: The Daily Shot(Past performance is no guarantee of future results.)
Read More
Chart of the Week: Honey, I Shrunk the Interest Coverage Cushions
The Fed’s “higher-for-longer” has compressed leverage loan coverage ratios. Source: PitchBook | LCD(Past performance is no guarantee of future results.)
Read More
Chart of the Week: All About Portfolios
Top three criteria investors use to select credit managers are portfolio-centric. Source: Coalition Greenwich 2023 Private Credit Market Structure Study(Past performance is no guarantee of future results.)
Read More


Subscribe Now!
Join the leading voice of the middle market. Try us free for 30 days.
Click here to view the Newsletter sample.
What is the Lead Left?

- One-stop source for deals and data
- Market trend commentary and analysis
- Exclusive interviews with thought leaders

View Article By
Features
Private Debt Intelligence – 5/6/2024

Direct lending dominates first quarter fundraising Demand for direct lending strategies has increased consistently over the past 15 years, as private credit has evolved from niche products such as mezzanine and distressed debt to a mainstream source of finance for deals and companies…. Login to Read More...
View ArticleMiddle Market & Private Credit – 5/6/2024


Fitch’s Privately Monitored Middle Market Portfolio Overview, 1Q24 Download FitchRating’s Report here. In the charts that follow, Fitch presents aggregate data for MM companies, defined as in the area of $500 million of debt or $100 million of EBITDA or below, that it privately rates for asset managers…. Login to Read More...
View ArticleMiddle Market & Private Credit – 4/29/2024

How Does the Default Outlook for the Middle Market Compare to BSL? Download FitchRating’s Report here. Fitch tracks defaults in our portfolio of about 300 middle market loans that we rate privately for asset managers. The default rate in this portfolio was about 3.7% in 2023, up from under 3% in 2022, also primarily due…
View ArticlePDI Picks – 4/29/2024


Fundraising falls flat There’s been talk of a modest revival in capital raising this year, but the first quarter may have lowered expectations. After a difficult time on the fundraising trail in 2023 as limited partners suffered from the denominator effect and lack of distributions, private debt managers were looking forward to a more benign…
View ArticleLeveraged Loan Insight & Analysis – 4/29/2024


Leverage declined for both direct lending and syndicated deals in 1Q24 Total leverage on sponsored middle market deals ticked down to 4.44x in 1Q24, driven by a drop in first lien leverage. First-lien leverage came in at 4.20x in 1Q24, down from 4.33x in 4Q23, while junior leverage in contrast increased modestly to 0.24x from…
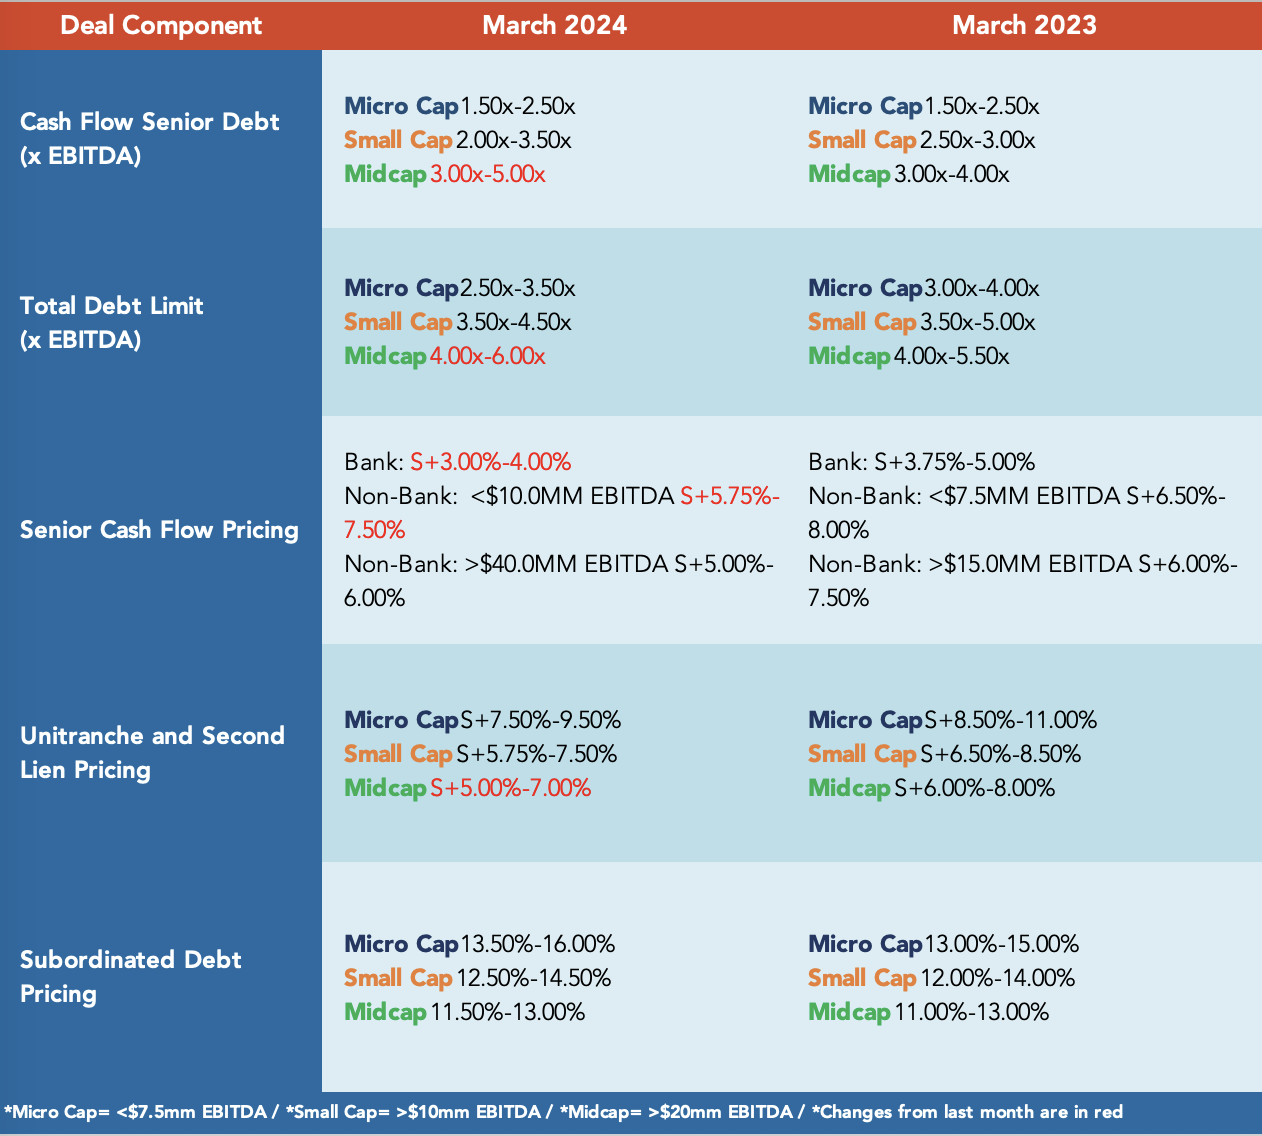
View ArticleMiddle Market Deal Terms at a Glance
provided by
![]()
Beginning in July 2022 The Lead Left published a series of articles on credit market. This report consolidates those articles.
Cov-lite trends Inflation & rising interest rates – LIBOR to SOFR transition Mega-tranche uni trend ESG takes center stage Login to view interactive report and download PDF version. … Login to Read More...
Beginning in September 2021 The Lead Left published a series of articles on supply chain. This report consolidates those articles.
Our Content Partners