Chart of the Week: Back at Ya
Cash back into investors’ pockets from loan repayments almost offset cash deployed into new loans last year.
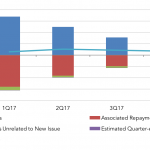
Cash back into investors’ pockets from loan repayments almost offset cash deployed into new loans last year.
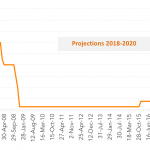
A Fed fund forecast of 2.1% by year end is well below historic levels, not to mention the 5.25% achieved in June 2006.
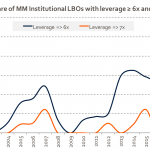
A record 52% of all middle market buyout financings are leveraged at or more than six times ebitda; 15% over 7x.
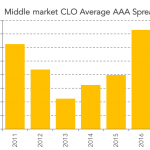
The average spread of the highest-rated middle market CLO liabilities has plummeted over 50 bps since last year.
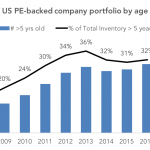
After a three year pause, the number of sponsor-backed portfolio companies held for over five years is rising.
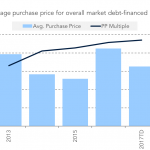
The average buyout price in the overall market has shrunk by $500 million so far this quarter, though it’s up as a multiple of ebitda.
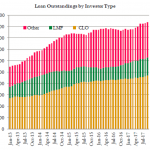
Collateralized loan obligations are still hold the majority of leverage loans, with separate managed accounts on the rise.
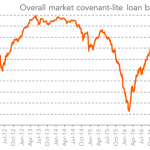
Bid levels for all covenant-lite loans have risen to 98, the highest in over two years.
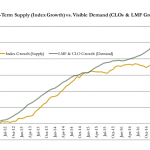
The growth of all leveraged loans has failed to keep up with the combined buying capacity from loan mutual funds and CLOs.
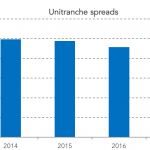
After slow declines in the past three years, unitranche spreads have dropped dramatically, thanks to competitive first lien/second lien structures.