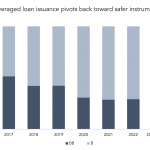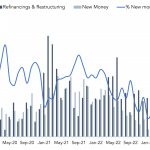
Debtwire Middle-Market – 5/29/2023
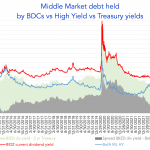
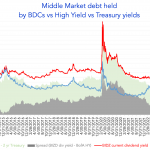
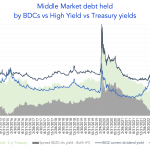
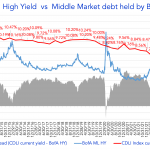
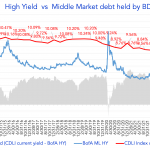
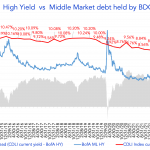
Source: VanEck BDC Income ETF and BofA Merrill Lynch US High Yield Effective Yield The red line in the chart is the current dividend yield of the *VanEck BDC Income ETF (BIZD) that tracks the overall performance of publicly traded business development companies (BDCs, lenders to privately held middle-market businesses that tend to be below…