Chart
Download Report
Click here to download CFA’s The 2019 Secured Finance Market Sizing & Impact Study
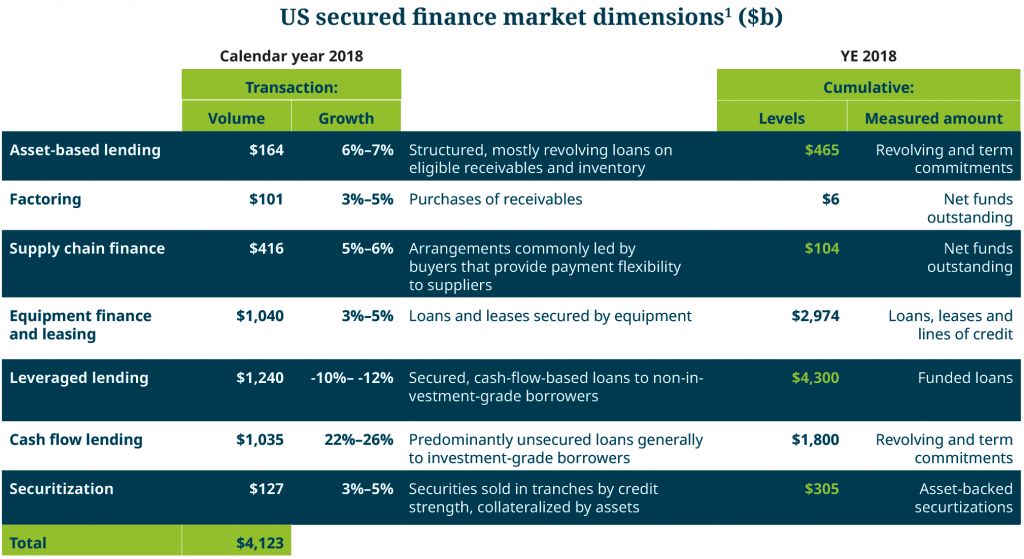
1 Indicated levels are Study estimates and subject to future revision. ABL: values based on total facility commitments and include syndicated and non-syndicated loans; Factoring: net funds outstanding assumes annual volume of factored purchases average 45-day terms with 22-day average outstanding funds; Supply chain finance: annual volume derived using an assumption of 90-day average terms on YE estimated outstanding amount; Equipment finance: annual volume uses assumptions from 2018 Equipment Leasing and Finance Foundation Industry Horizon report, outstanding level assumes five-year amortizing terms; Leveraged lending and cash flow lending: Study estimates based on LPC Refinitiv data; Securitization: includes only commercial asset-related ABS, Study estimates based on SIFMA data.
The Commercial Finance Association Education Foundation, with assistance from Ernst and Young, LLP, recently released the findings of a year-long comprehensive study of the scope and impact of the Secured Commercial Finance Marketplace in the US (the “Study”). The outcomes, which are based on a wide-ranging survey of industry participants, coupled with secondary research and in-depth interviews with subject matter experts were released earlier this year at the Commercial Finance Association’s annual Asset-Based Capital Conference in Las Vegas. The US Secured Commercial Finance Marketplace is comprised of several large and distinct, but interrelated, product segments including asset-based lending, factoring, supply chain finance, equipment finance, asset-backed securities, leveraged loans and related unsecured cash- flow loans that that collectively employ over 60,000 people providing capital to greater than 1 million companies, or approximately one third of all US businesses.
Sizing the overall secured finance market requires understanding the lending activity of over 5,000 commercial banks and another approximately 1,500 non-depository lenders across the US. The table above summarizes this Study’s estimates of secured financing volumes for 2018, the 2018 growth rates of these volumes and amounts outstanding as of year-end (YE) 2018. The volume of transaction flow across each category tallies to over $4.1 trillion, which means the business of secured finance underpins, either directly or indirectly, about one-fifth of the transaction volumes that make up the $20 trillion US gross domestic product.
Contact: Aydan Savaser
